Category Archives: Social psychology

Did Ebola Influence the 2014 Elections (Revisited)?

Social psychologists have known for a long time that (a) politically conservative people are more responsive to fear-arousing threats, such as news about terrorism or weather emergencies, and that (b) reminding them of these threats causes people to become more conservative in their attitudes. Due to COVID-19, this is a time when we are all confronting our own mortality. (How many of you, in the last six weeks, have thought about the current status of your will?) This raises the question of what effect the coronavirus will have on the 2020 elections.

This week the Association for Psychological Science reprinted a 2016 research study by Alec Beall and colleagues entitled “Infections and Elections: Did an Ebola Outbreak Influence the 2014 U. S. Federal Elections (And If So How)?” Unfortunately, the study is gated, so only members can read it, but I wrote a blog post about it on December 31, 2016, shortly after its publication. Here is that post. After you’ve read it, I’ll return with some comments (also in italics).


Republicans did very well on Election Day 2014, gaining control of the Senate for the first time in eight years and increasing their majority in the House of Representatives. Most pundits attributed these results to low turnout by Democrats in a non-presidential election year and to President Obama’s poor approval ratings, due primarily to the disastrous rollout of the Affordable Care Act earlier that year. But a recent paper by Alec Beall and two other psychologists at the University of British Columbia suggests that breaking news about the Ebola epidemic also played a significant role in the election outcome.

Their paper contains two studies, both of which are interrupted time series designs. In this design, data that are routinely collected are examined to see if they change after a specific event. In the first study, they analyzed the aggregate results of all polls conducted between September 1 and November 1, 2014 that asked respondents whether they intended to vote for a Democrat or a Republican in their upcoming House election. The “interruption” occurred when Center for Disease Control announced the first Ebola case in the U. S. on September 30. The research question was whether the poll results changed from before to after that date.

The above results show support for the Republican candidate minus support for the Democratic candidate in the month (a) and the week (b) before and after the Ebola story broke. In both cases, the temporal trends were significantly different from before to after September 30. The before and after lines had different slopes, and the shift was in favor of the Republican candidates. The authors also collected data from Google on the daily search volume for the term “Ebola,” and found that it too was positively related to Republican voting intentions.

Beall and his colleagues examined two possible alternative explanations—concern about terrorism and the economy. They measured daily search volume for the term “ISIS,” and checked the Dow-Jones Industrial Average, which was dropping at the time. Interest in ISIS was (surprisingly) negatively related to Republican voting intentions and the stock market had no significant effect.

In their second study, the authors looked at the 34 Senate races. They computed 34 state-specific polling averages by subtracting Democratic voting intentions from Republican intentions. Then they subtracted the September results from the October results. Thus, a higher number would indicate a shift toward the Republican candidate. The aggregate results showed a significant increase in Republican voting intentions after September 30.

However, not all states shifted in the same direction. Using Cook’s Partisan Voter Index, they determined whether each state had voted more for Republicans or Democrats in recent years. Then they analyzed the data separately for “red” and “blue” states. The results are shown below.

The changes were in the direction of the state’s dominant political party. In the red states, the Republican candidate did better after September 30. In the blue states, the Ebola scare seemed to help the Democrat, although the effect was smaller. This could also be interpreted as a shift toward the favorite, since candidates who were leading before September 30 tended to do even better after that date.

This study is part of a small but increasing body of research which shows that external threats that cause fear in the population seem to work to the advantage of conservative political candidates. In a previous post, I reported on a British study which indicated that the 2005 London bombings increased prejudice toward Muslims. More to the point is a 2004 study in which reminding participants of the 9/11 terrorist attack on the World Trade Center increased support for President George W. Bush in his campaign against John Kerry. These studies are consistent with older research suggesting that social threats are associated with an increase in authoritarianism in the U. S. population. Authoritarian attitudes are characterized by obedience to authority, hostility toward minority groups and a high degree of conformity to social norms.

Surprisingly, Beall and his colleagues did not mention terror management theory as a way of understanding their results. According to this theory, human awareness of the inevitability of death—called mortality salience—creates existential terror and the need to manage this terror. One way people manage terror is through defensive efforts to validate their own cultural world views—those attitudes that give their lives meaning and purpose. Previous research suggests that mortality salience results primarily in conservative shifts in attitudes, including support for harsher punishment for moral transgressors, increased attachment to charismatic leaders, and increases in religiosity and patriotism. (A charismatic leader is one whose influence depends on citizen identification with the leader or the nation-state, as in “Make America great again.”) The Bush v. Kerry study mentioned in the preceding paragraph was intended to be a test of terror management theory.

One of the effects of saturation coverage of the Ebola epidemic was to remind people of the possibility of their own death and that of loved ones. The results of the 2014 House elections are consistent with a terror management interpretation. The Senate results do not contradict the theory, since there was an overall shift in favor of Republican candidates, but they add an additional detail. In states that usually voted Democratic, the Ebola scare increased support for Democrats. If mortality salience causes people to reaffirm their cultural world views, this could have produced a shift toward liberalism in states in which the majority of citizens held progressive attitudes.

Research findings such as these suggest the possibility that political parties and the corporate media might strategically exaggerate threats in order to influence the outcomes of elections. Willer found that government-issued terror alerts between 2001 and 2004 were associated with stronger approval ratings of President Bush. Tom Ridge, Director of Homeland Security at the time, later admitted that he was pressured by the White House to increase the threat level before the 2004 election. Since that time, it has become routine for Republicans to emphasize threats to the public’s well-being more than Democrats, and evidence from the 2016 presidential debates suggests that the media gave greater attention to Republican issues.

Republicans made Ebola an issue in the 2014 election, claiming that President Obama was failing to adequately protect public health and arguing that he should close the borders and not allow Americans suffering from the virus back into the country for treatment. In retrospect, news coverage of the threat of Ebola appears to have created unnecessary panic. Analysis of the motives of the media decision makers is complicated by the knowledge that they also exaggerate threats because they believe that increasing public fear leads to higher ratings. Media Matters for America presented data showing that coverage of Ebola plummeted immediately after the 2014 election was over (see below). However, I know of no “smoking gun” showing that the corporate media deliberately created panic in order to help Republican candidates.


Addendum

It’s interesting to speculate about how the coronavirus affected the 2020 Democratic primary contest. The first known American death due to COVID-19 occurred near Seattle on February 28. The sudden reversal of fortune in which the most conservative candidate Joe Biden burst into the delegate lead at the expense of the most liberal candidate Bernie Sanders began with the South Carolina primary on Saturday, February 29, and continued with the Super Tuesday contests on March 3. Over that weekend, one of the top news stories was the dramatic spike in the number of infections in Europe. President Trump finally declared a national emergency on March 13, by which time the Democratic contest was essentially over. It seems plausible that the coronavirus was a background factor that helped convince Democrats not to risk going into the 2020 election with a candidate that Trump might brand a socialist, and to choose a more familiar candidate.

I’m not suggesting that the coronavirus will guarantee the reelection of President Trump or the election of any other Republican candidate. I’m sure you’ve noticed that the data in Beall’s study were collected within just a few days of the peak of publicity surrounding the Ebola virus. A lot can happen between now and November. In the unlikely event that the coronavirus is no longer a problem, its effect on the elections may be minimal. In the case of the president, the success with which he is perceived to have responded the emergency should logically be more important than the existence of the emergency itself. But the polling done thus far suggests that there is very little agreement among partisans on how effectively Trump has dealt with the crisis. And the Ebola study suggests that the pandemic could even influence the outcomes of down-ballot races for political offices have no direct effect on the epidemic or our recovery from it.

If nothing else, Beall’s research should alert us to the importance social context during an election, including external threats that are sometimes overlooked because they are not explicitly political. It should also make us mindful of politicians and media sources that attempt to either exaggerate or downplay these events.

Publicizing Bystander Intervention

John Tumpane is a hero. On Wednesday, June 28, this Major League Baseball umpire was crossing the Roberto Clemente Bridge on his way to PNC Park in Pittsburgh, where he was to call ball and strikes in the Pirates’ game against the Tampa Bay Rays that night. He spotted a 23-year-old woman who had climbed over the railing and was looking down at the Allegheny River. As it turned out, she intended to commit suicide. Mr. Tumpane calmly attempted to talk her out of it, and eventually, with the help of some other passers-by, physically restrained her from jumping while another bystander called 911.

Believe it or not, an umpire is applauded at PNC Park.

Mr. Tumpane received a standing ovation at PNC Park the following night, and the story received both local and some national attention in the news media, including a front-page article in the Pittsburgh Post-Gazette the following day, quoting Dr. Christine Moutier of the American Foundation for Suicide Prevention saying that he did all the right things. From the perspective of social psychology, the important point is that he didn’t fall victim to the bystander effect.

The bystander effect does not refer to the failure of bystanders to intervene in an emergency. It refers to the paradoxical finding that the greater the number of bystanders, the less likely and more slowly they are to intervene. Two social psychologists, John Darley and Bibb Latane, read about the 1964 murder of Kitty Genovese in New York City. It was originally reported that 38 people had witnessed the assault, yet no one intervened or called the police for 35 minutes. Darley and Latane hypothesized that the large number of bystanders was the key to understanding their failure to take action, and initiated a research program demonstrating that helping declines as group size increases. Researchers have recently concluded that the original news reports of Ms. Genovese’s death were exaggerated. Not all 38 people actually witnessed the murder and some of them called the police sooner than was originally reported. Nevertheless, the bystander effect has been replicated in dozens of studies.

Kitty Genovese and her Queens, New York neighborhood.

It’s not that surprising that bystanders fail to intervene. As Darley and Latane point out, a bystander must successfully work through five steps before intervention can take place. He or she must:

  • Notice the event
  • Interpret it as an emergency
  • Assume responsibility
  • Know the appropriate form of assistance
  • Implement a decision to help

The presence of others can interfere at any of these steps, but particularly the second and the third, where bystander intervention can be inhibited by either pluralistic ignorance or diffusion of responsibility.

Pluralistic ignorance. Is this really a suicide attempt, or is the young woman just clowning around? It would be embarrassing to make a fool of oneself by overreacting to a benign event. When in doubt, we look to other bystanders for cues to their interpretation of the situation. But they may also be trying to appear outwardly calm, looking to us for information. As a result, the bystanders could fall victim to pluralistic ignorance, in which a group of people arrive at a definition of the situation that is different from their individual first impressions. They may come to believe that nothing is wrong because no one else looks concerned.

We know from the newspaper article that Mr. Tumpane was initially uncertain about whether he was witnessing an emergency. He asked a couple in front of him, “What’s this lady trying to do?” and they said, “I don’t know.” Fortunately, this did not deter him from interpreting the situation as a possible emergency.

Diffusion of responsibility. We don’t know how many people were on the Clemente Bridge that afternoon. The article says it was “mostly empty.” This may have helped Mr. Tumpane to avoid diffusion of responsibility. If only one person had been aware of the emergency and failed to intervene, he or she might be considered responsible for the woman’s death. But the greater the number of bystanders, the more responsibility is diffused, or spread out, among the witnesses. With many bystanders, no one feels responsible.

Since there were at least a few other bystanders on the bridge that afternoon, we can credit Mr. Tumpane with taking the lead in assuming responsibility. He also knew how to help a person in distress and did so skillfully.

By the way, one of the take-homes from this research is that if you are ever the victim of an emergency in a busy environment, it is best to single out one of the bystanders (to avoid diffusion of responsibility), tell this person that you need help (to avoid pluralistic ignorance), and, if possible, tell him or her exactly what you need, i.e., “Call 911!”

Failures of bystanders to intervene in emergencies are often publicized by the news media. Such stories may unintentionally increase cynicism. Fortunately, Mr. Tumpane’s helpfulness also received media attention and recognition.

Another place people hear about bystander intervention or its absence is in social psychology classes. One group of researchers randomly assigned students to hear a lecture either on Darley and Latane’s experiments, which included information about how to respond appropriately to an emergency, or a totally different topic (the control group). Two weeks later, as part of what they thought was an unrelated study, each of these students encountered a young man lying motionless on the floor. Was he sick or injured, or merely drunk or asleep? Only 25% of the students in the control group stopped to help the student, but 43% of those who had heard the lecture on bystander intervention stopped to help. Far from perfect, but better.

People often claim they would like the media to tell them more good news. Publicizing successful instances of bystander intervention, along with information about how best to intervene, would seem to be win-win for both the news media and future victims of emergencies.

You may also be interested in reading:

Here I Am. Do You See Me?

More Bad News for Religion

Correction

Why “Bad Dudes” Look So Bad

A 2016 Washington Post analysis showed that Black Americans are 2.5 times as likely to be shot and killed by police officers than White Americans, and that unarmed Blacks are 5 times as likely to be shot dead than unarmed Whites. While there are many explanations for this finding, there is little support for the knee-jerk conservative response that attributes this racial disparity to the fact that Blacks commit more crimes. An analysis of the U. S. Police Shooting Database at the county level found no relationship between the racial bias in police shootings and either the overall crime rate or the race-specific crime rate. Thus, this racial bias is not explainable as a response to local crime rates.

When police officers shoot an unarmed Black teenager or adult, they are not likely to be convicted or even prosecuted if they claim to have felt themselves threatened by the victim. This suggests that it’s important to look at factors that affect whether police officers feel threatened. A study by Phillip Goff and others found that participants overestimated the ages of teenaged Black boys by 4.5 years compared to White or Latino boys, and rated them as less innocent than White or Latino boys when they committed identical crimes. While age may be related to perceived threat, the present study by John Paul Wilson of Montclair State University and his colleagues is more relevant, since it looks at the relationship between race and the perceived physical size and strength of young men.

The researchers were extremely thorough. They conducted seven studies involving over 950 online participants. Unless otherwise specified, participants were shown color facial photographs of 45 Black and 45 White high school football players who were balanced for overall height and weight. In the first study, the Black athletes were judged to be taller and heavier than the White athletes. Furthermore, when asked to match each photo with one of the bodies shown below, they judged the young Black men to be more muscular, or, as they put it, more “formidable.”

In a second study, participants were asked to imagine that they were in a fight with the person in the photograph, and were asked how capable he would be of physically harming them. The young Black men were seen as capable of inflicting greater harm.

In the third study, the authors examined the possibility that racial prejudice might predict these physical size and harm judgments. A fairly obvious measure of prejudice was used. Participants were asked to complete “feeling thermometers” indicating their favorability toward White and Black people. This measure of prejudice was only weakly associated with the participants’ judgments of Black-White differences in harm capability and not at all with Black-White differences in harm perception.

Up to this point, Black participants were excluded. However, the fourth study compared Black and White participants. Both Blacks and Whites saw the young Black men as more muscular, though the effect was larger for Whites. Only White participants saw the Black men as more capable of inflicting harm. Apparently Black participants subscribe the the size stereotype, but not to the stereotype about threat.

The fifth study was an attempt to apply these results to the dilemmas faced by police officers. Once again, both Blacks and Whites participated. They were asked to imagine that the young men in the photographs had behaved aggressively but were unarmed. How appropriate would it have been for the police to use force? White participants saw the police as more justified in using force against the young Black men than against the young White men. For the Black participants, there was no difference.

Previous research had shown that Black men who have an Afrocentric appearance—that is, who have dark skin and facial structures typical of African-Americans—are treated differently than Black men who are less prototypical. For example, in a laboratory simulation, participants are more likely to “shoot” a Black man if he has Afrocentric features, and a Black man convicted of murder is more likely to be sentenced to death if he is prototypical. The sixth study showed that young Black men whose facial features are prototypical are seen as more formidable and the police are seen as more justified in using force against them. Furthermore, this is true even when participants are shown photos of young White men. That is, White men with darker skin and facial features resembling Black men are seen as more muscular than other White men, and participants believe the police are more justified in using force against them.

In the final study, participants were shown the exact same photographs of men’s bodies with the head cropped off, but they were given additional information indicating the man was either White or Black. The photos were color-inverted to make the man’s race difficult to detect. The man’s race was indicated either by a Black or White face said to be the man in the photo, or a stereotypically Black or White first name. Results indicated that the very same bodies were seen as taller and heavier when the man was presumed to be Black than when he was presumed to be White.

You might be wondering whether Black and White men actually differ in size. Data from the Center for Disease Control shows that the average Black and White male has exactly the same weight, and that Whites are on average 1 cm taller. Therefore, when participants see Black men as larger, they are not generalizing from their real world experience.

These studies are important in explaining why police officers feel more threatened by young Black men than young White men, and why jurors are more likely to see the killing of young Blacks as justified. It may help to explain why no charges were brought against a Milwaukee police officer who shot Dontre Hamilton 14 times. The officer described Hamilton as “muscular” and “most definitely would have overpowered me or pretty much any officer I can think of.” Hamilton was 5’7” and weighed 169 lbs.

It is important to realize that the results of these studies are not readily explained by conscious race prejudice. This size estimation bias is probably automatic and unconscious, and is most likely to affect behavior when a police officer must make a split-second decision. The fact that officers are likely to be found not guilty of using excessive force against a Black victim if they testify that they felt threatened is troubling, since it suggests that implicit racial bias can be used successfully as a defense when charged with a violent crime.

You may also be interested in reading:

Publicizing “Bad Dudes”

Teaching Bias, Part 1

Making a Mockery of the Batson Rule

October Surprise

Articles that end with confident assertions such as, “And that’s why Donald Trump is president,” are inherently suspect. A presidential campaign is a complex chain of events in which an almost infinite number of factors could have influenced public opinion by an amount greater than or equal to the margin of victory.

Consider this analogy. On the last play of the game, a football team is trailing by one point. Their kicker misses a relatively easy field goal from the opponent’s 25 yard line. Most spectators are likely to conclude that the missed field goal was the cause of their loss. However, if we were to watch a replay of the game, we might find dozens of offensive and defensive mistakes that, had they turned out differently, would have changed the outcome of the game. Picking any one of them as “the cause” of the loss is essentially arbitrary. It was the kicker’s bad luck to have failed on the very last play. Since it is readily available in everyone’s memory, people see it as the cause of his team’s defeat.

This is the first reason you should disregard the data I’m about to present and be skeptical of the claims that have been made for them.

An organization called Engagement Labs does market research in which they attempt—for a price—to measure consumer attitudes toward brand name products. They do this by asking an online sample of consumers to report whether they have had any positive or negative conversations about the product. The difference between the percentages of positive and negative conversations is their measure of consumer “sentiment” toward the product.

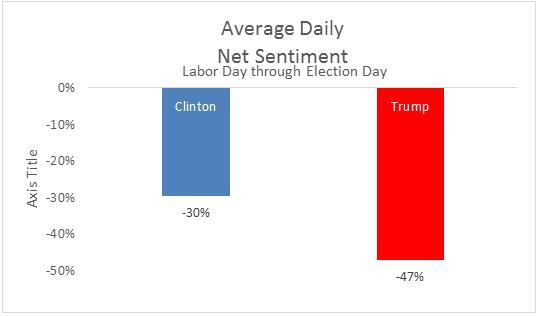
Every four years, out of curiosity, this organization asks their respondents to report positive and negative conversations about the two major party presidential candidates. Not surprisingly, Americans had negative attitudes toward both candidates. Averaged over the duration of the campaign (Labor Day to Election Day), attitudes toward Trump (-47%) were more negative than attitudes toward Clinton (-30%).

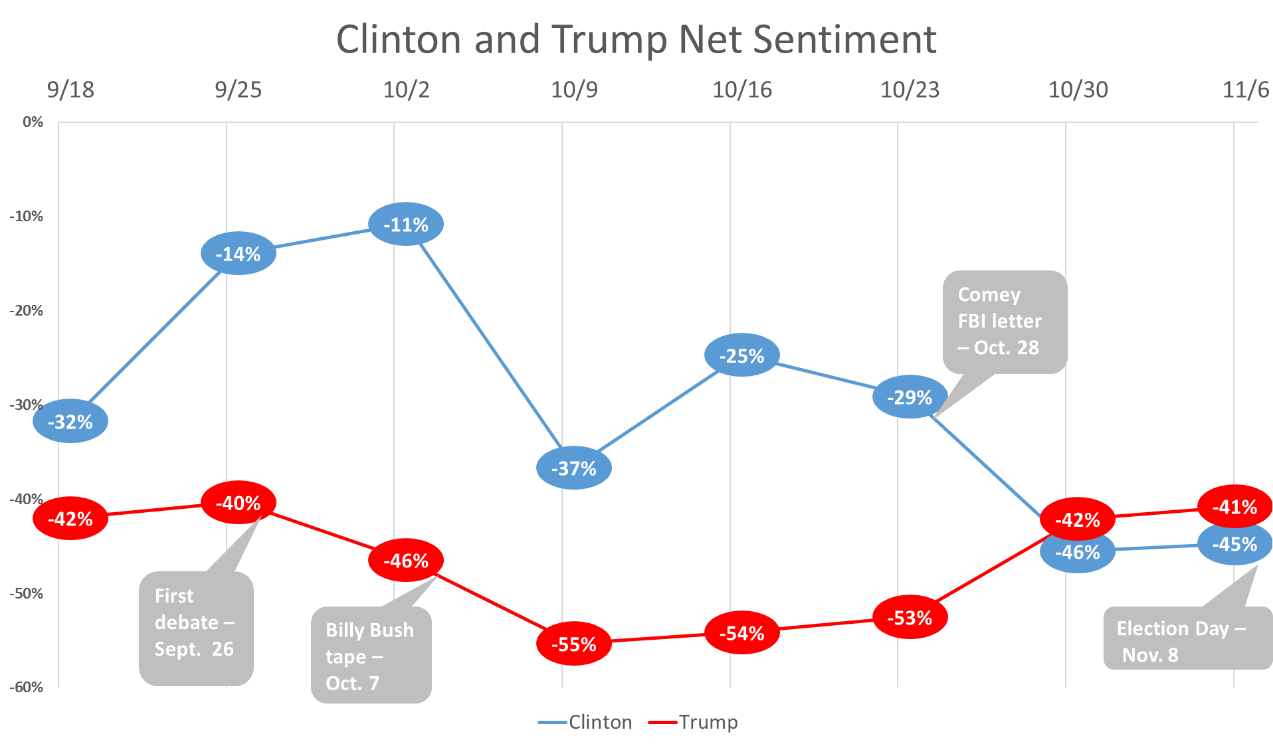
However, between the surveys conducted on October 23 and October 30, there was an abrupt change in their respondents’ conversations. October 28 was the day that FBI Director James Comey sent a letter to Congress stating that he was reopening his investigation of Hillary Clinton’s emails. Here are the data.

Two days after Comey’s letter, attitudes toward Clinton dropped by 17% and attitudes toward Trump increased by 11%—a 28% shift, sufficient to put Trump ahead. Trump maintained that slight edge on November 6, two days before the election.

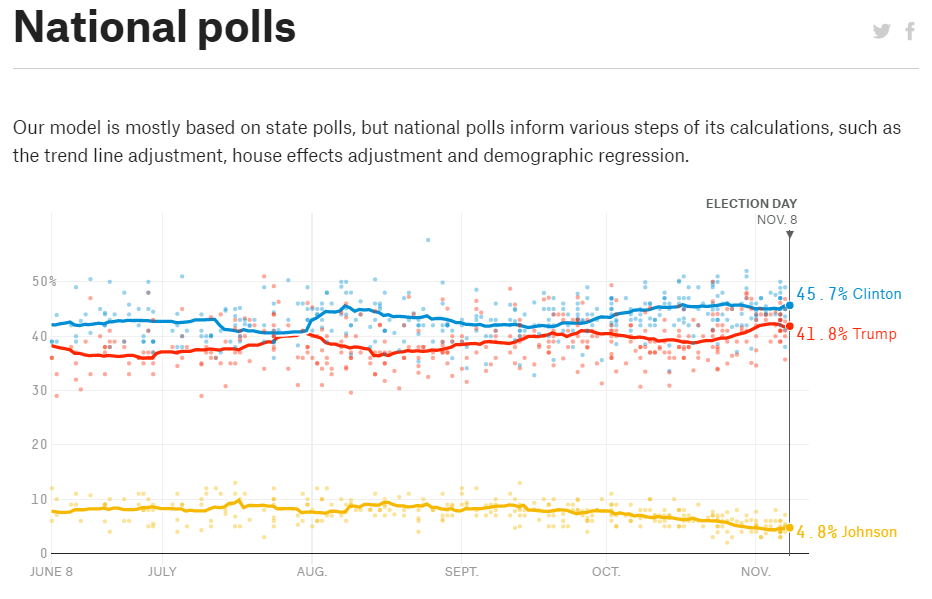
This is an astonishing change in attitudes. Such a large shift is almost never reported in pre-election surveys. Here’s the average of pre-election polls conducted by traditional methods.

Why didn’t other pre-election surveys report this abrupt shift in attitudes following Comey’s letter? Brad Fay, Chief Commercial Officer of Engagement Labs, maintains that their measure of political sentiment is a more sensitive predictor of election outcomes than the typical survey question which asks respondents for whom they intend to vote. He gives four reasons.

  1. Behavior predicts behavior better than attitudes do. The behavior being predicted in this case includes the decision of whether to vote or stay home as well as for whom to vote.
  2. The invisible offline conversation matters.
  3. Conversations amplify the impact of the media.
  4. Humans are a herding species. This is Fay’s way of saying that people conform to the expressed attitudes of other people.

As a social psychologist, I accept Fay’s first argument. Attitudes don’t always predict behavior very well. However, past behavior is a relatively good predictor of future behavior. In this case, the behavior of stating your opinions to friends can encourage you to behave in a way that is consistent with those opinions. Fay’s last three reasons are semi-redundant. They are different ways of saying that our behavior is influenced by the attitudes of our peers.

However, there is a second reason you should be skeptical of the information in this post. I’ve searched the Engagement Labs website in vain for basic information about how their surveys were conducted—their sample size, their method of ensuring the representativeness of their sample, the wording of their questions, etc. All I can find is jibberish such as “(t)he data are fed into our TotalSocial platform, where it is scored and combined with social media data to capture the TotalSocial momentum for leading brands.” They probably regard this information as a trade secret. But until such information is provided, I’ll have to claim that this is an intriguing finding of uncertain validity.

You may also be interested in reading:

So Far, It Looks Like It Was the Racism

Looking For an Exit

Counterfactual

The Stress of Technology

The American Psychological Association has released Part 2 of its August 2016 survey of Stress in America dealing with technology and social media. Please see this previous post for basic information about how the survey was conducted.

According to this survey, 99% of Americans own at least one electronic device (which includes radio, television and telephones), 86% own a computer, and 74% own an internet-connected smart phone. The latter two figures seem suspiciously high to me. This may be related to the fact that it was an online survey. (Their methodology section notes that the data were weighted “to adjust for respondents’ propensity to be online,” but it doesn’t mention how people who have no internet connection were contacted.)

The Pew Research Center reported that the percentage of Americans using social media increased from 7% in 2005 to 65% in 2015. Among young adults aged 18 through 29, it was 12% in 2005 and 90% in 2015.

The APA survey finds that 18% of Americans say that technology is a very or somewhat significant source of stress in their lives. To put this in perspective, 61% report money as a very or somewhat significant source of stress, and 57% say the same for the current political climate.

Forty-three percent of Americans report that they constantly check their emails, texts or social media accounts, and another 43% check them often. Here is the breakdown of constant and frequent checkers on work and non-work days.

The constant checkers report a higher overall level of stress–5.3 on a 10-point scale, compared to 4.4 for everyone else. For employed Americans who check their work email constantly on non-work days, the overall stress level is 6.0. Of course, they may be people with more stressful jobs, one symptom of which is that they are expected to check their email on non-work days.

Constant checkers were also more likely to see technology as a very or somewhat significant source of stress.

These findings are generally consistent with a 2013 study which found that the more often their participants used Facebook, the lower their moment-to-moment self-ratings of happiness and the lower their overall satisfaction with their lives.

Not surprisingly, millennials (aged 18 to 37) report greater dependence on social media.

They are also more worried about their negative effects.


It is predictable that the negative aspects of this survey will be exaggerated by the mainstream media. For example, Bloomberg News ran an article about it this morning with the understated headline “Social Media Are Driving Americans Insane.”

You may also be interested in reading:

The Stress of Politics

Finding the Sweet Spot

The Stress of Politics

Since 2007, the American Psychological Association (APA) has contracted with the Harris Poll to conduct an annual survey of Stress in America. Respondents are asked to rate their typical level of stress on a 10-point scale, where 1 = little or no stress and 10 = a great deal of stress. They are also asked to rate a variety of sources of stress as either very significant, somewhat significant, not very significant or not significant.

Until now, the APA survey has been a lackluster affair, with average stress levels remaining pretty much the same from year to year, and the most significant sources of stress being money, work and the economy. But that changed with the 2016 survey, due to the addition of some questions about politics.

The 2016 survey was conducted in August, with a sample of 3511 U. S. adults aged 18 or older. Because so many respondents (52%) reported that the 2016 presidential campaign was a very or somewhat significant source of stress, APA did a followup in January 2017 to see if the political climate had cooled off. January’s survey had a reduced sample size of 1,109—still a respectable number. Unless otherwise specified, the data reported below are from this most recent survey.

The overall stress level increased between August and January, from 4.8 to 5.1 on the 10-point scale. While that may not sound like much of a change, this was the first time in the history of the survey that there was a statistically significant increase in stress between consecutive samples. The percentage of respondents reporting physical symptoms of stress also increased, from 71% in August to 80% in January. The most commonly-reported symptoms were headaches (34%), feeling overwhelmed (33%), feeling nervous or anxious (33%), and feeling depressed or sad (32%).

As in previous years, economic and job-related sources of stress were among the the most important. Sixty-one percent reported that money was a very or somewhat significant source of stress; 58% said the same for their work; and 50% for the nation’s economy. However, these numbers were rivaled by three stressors related to politics.

Not suprisingly, responses to two of these questions were influenced by political partisanship. Democrats were more likely than Republicans to be stressed by the election outcome (72% vs. 26%), and by concern about the future of the country (76% vs. 59%).

Stress about the election outcome was influenced by several demographic variables. It varied by race.

It also varied with age.

And it varied by place of residence.

Education also made a difference, with 53% of those with more than a high school education being stressed out by the election outcome, compared to 38% with a high school education or less.

Some stressors that were presidential campaign issues increased in importance since the last survey. Those saying that terrorism was a very or somewhat significant source of stress went from 51% in August to 59% in January. Those concerned about police violence toward minorities went from 36% to 44%. And the rate of concern over one’s own personal safety increased from 29% to 34%.

Here’s the breakdown of concern about police violence by race. Black respondents appeared to show a ceiling effect. Their stress level didn’t increase very much because it was quite high to begin with.

Americans are usually described as apathetic about politics.  Partisan political conflict usually declines after a presidential campaign is over, but that hasn’t happened this year. Stress over the election outcome is almost as high (49%) as stress over the campaign itself was (52%). It is tempting to attribute this to a growing awareness among Americans that they have elected a man who is unfit to be president, or to the fact that Republicans seem determined to proceed with a political agenda most of which is not supported by a majority of citizens. Unfortunately, we don’t have historical data with which to compare stress over this election outcome to the same question after the 2000 and 2008 elections.

We also can’t be certain whether the rhetoric of the presidential campaign increased concern over terrorism, police violence and our personal safety, since perceptions of those stressors may have been influenced by real events that occurred between August and January, i.e., actual acts of terrorism or police violence. However, it seems obvious that Donald Trump tried to elevate anxiety about terrorism and personal safety to an unrealistically high level. The APA survey suggest that he may have been successful. Whether Hillary Clinton’s campaign raised concerns about police violence is less clear, since she typically called for greater respect for the police as well as clearer use of force guidelines.

You may also be interested in reading:

So Far, It Looks Like It Was the Racism

Why the Minority Rules

Framing the Debates

They Saw an Inauguration

On November 23, 1951, Princeton University’s football team beat rival Dartmouth in a hotly contested game in which key players on both sides suffered injuries and there were several infractions. The referees saw Dartmouth as the primary aggressor, penalizing them 70 yards to Princeton’s 25. In the aftermath, there was controversy in the press about allegations of overly rough and dirty play.

In 1954, social psychologists Albert Hastorf (of Dartmouth) and Hadley Cantril (of Princeton) put aside their differences and published a study entitled “They Saw a Game.” Two types of data were collected. Samples of Dartmouth and Princeton students were given a questionnaire measuring their recall of the game. Secondly, a smaller sample of 48 Dartmouth and 49 Princeton students were shown a film of the game and asked to identify any rule violations they saw. The results suggested that they saw a different game. For example, on the questionnaire, 86% of Princeton students but only 36% of Dartmouth students thought that Dartmouth had started the rough play. The mean numbers of judged infractions are shown here:

Dartmouth students thought the number of violations had been about equal, but Princeton students saw more than twice as many infractions by the Dartmouth players.

This study is an example of myside bias, which is in turn a special case of confirmatory bias, the tendency to search out, interpret and recall information in a way that supports your pre-existing beliefs. (“Myside bias” is more likely to be used when two competing groups, such as Democrats and Republicans, are at odds.) There are hundreds of studies of confirmatory bias.

For example, Dan Kahan and his colleagues did a study entitled “They Saw a Protest.” Participants were shown a video of a political demonstration. Half were told that it was a protest against the military’s “don’t ask, don’t tell” policy, and the others that it was an anti-abortion protest. As expected, liberals and conservatives differed on whether they had observed free speech or illegal conduct. Liberals were more likely to see the demonstrators as obstructing and threatening bystanders when the demonstration was identified as anti-abortion, while conservatives were more likely to see the anti-military protest as containing illegal behavior.

Inspired by the flagrant misperceptions of President Donald Trump, political scientist Brian Schaffner and Samantha Luks of the YouGov polling organization surveyed 1388 American adults on January 23 and 24. They showed them the two photographs below.

Half the respondents were asked which photo was from the Trump inauguration and which was from President Obama’s 2008 inauguration. The other respondents were simply asked which crowd was larger. Finally, all participants were asked for whom they had voted.

The data on the left show that, consistent with their presumed belief that Trump has broad public support, Trump voters were more likely to misidentify Photo B as his inauguration than either Clinton voters or non-voters. A more surprising result is shown at right. Fifteen percent of Trump voters said that Photo A contained more people!

The finding that Trump voters were more likely to choose B as the Trump inauguration is an example of myside bias. People (mis)identified the photos in way that was consistent with their political affiliation. An alternative explanation is that, since Trump voters are more likely to be what political scientists call “low information voters”—people who don’t often follow the news—they were less likely to have seen the two photos on TV or in a newspaper. It’s unfortunate that the authors didn’t ask respondents whether they had seen them before.

The behavior of the Trump voters who said Photo A had more people is more difficult to interpret. We can assume that they deliberately gave an incorrect answer. The authors interpret this as a partisan attempt to show their support for Mr. Trump, which has been called expressive responding. A related possibility is that they may have suspected the study was an attempt to embarrass Mr. Trump, and their response was an upraised middle finger directed at the researchers.

You may also be interested in reading:

In Denial

Is Democracy Possible, Part 1

Bullshit: A Footnote

Correction

In November 2015, I reported a study of 1170 children from six countries (Canada, China, Jordan, South Africa, Turkey, and the US) by Jean Ducety and his colleagues. The study appeared to show that children from Christian and Muslim households were less altruistic when playing a laboratory game than children from religiously unaffiliated households. It now appears that their conclusion was incorrect.

When correlating religion with altruism, it is necessary to statistically control unwanted variables that might explain both religiosity and altruism. The Ducety team claimed to have controlled for the age, socioeconomic status, and country of origin of their participants. However, a team of researchers headed by Azim Shariff pointed out that, although Ducety and his colleagues intended to statistically control for country of origin, they used a statistically incorrect procedure. When the data were reanalyzed correctly, the association between religion and altruism was no longer statistically significant. This is primarily due to low levels of generosity among children from South Africa and Turkey, two countries with a high level of religious affiliation.

The correct conclusion, then, is that religion has no effect on altruistic behavior. I’m not sure that religious people will be happy with this conclusion, but at least it’s less embarrassing than Ducety’s conclusion. Shariff and his colleagues also point out the following:

  • When nationality was controlled correctly, there was no longer an association between religion and the punitiveness of the children.
  • The association between religion and parents’ claims that their children are higher in empathy also disappeared when the data were reanalyzed.
  • However, there was still a significant association between family devoutness and the altruism of the children, with children from highly religious families being less generous than children from moderately religious homes.

This is an embarrassment for the Ducety group. Had the data been analyzed correctly, the study would probably not have been published.

In 2015, Sharif reported the results of a meta-analysis of 31 studies showing that, while religious people claim to engage in more prosocial behavior on self-report measures, there is no consistent effect of religion on behavioral tasks measuring altruism, such as the one used by Ducety group. He explains this in two ways. First, religious people are more likely to engage in socially desirable responding in which they exaggerate their good behavior. Secondly, laboratory tasks measuring altruism do not contain the contextual cues that sometimes elicit prosocial behavior in the real world, such as being asked by a clergyman to donate money.

In support of this second explanation, Sharif points to a second, separate meta-analysis of 25 studies of religious priming on prosocial behavior. In these studies, participants perform a task intended to remind them of their religious beliefs, such as reading Biblical passages, and are then given an opportunity to behave more or less generously. These studies find that religious primes increase the altruism of religious people, but have no effect on non-religious people.

Sharif explains the effects of religious primes in two ways. First, some religious rituals such as hymn-singing and prayer may create the emotional conditions which encourage people to behave prosocially. Secondly, these primes may remind religious people that they believe they are being observed by supernatural agents who will punish them if they behave badly.

My takeaway from Sharif’s research is that most opportunities for altruistic behavior in the real world probably do not contain religious primes. If I’m right, we should usually not expect religious people to practice the values that are preached to them.

An optional wonkish addendum:

Any time you do a correlational study, you must consider the possibility that your results are explained by some other variable that accidentally coincides with both of the variables of interest. For example, if you find that people who live near nuclear power plants are more likely to die of cancer, you must consider the possibility that poor people are more likely to live near nuclear power plants, and their poverty is the cause of their death rather than their exposure to radiation.

The usual approach to such alternative explanations is to remove their impact on the data through statistical analysis. However, it is not always clear whether an alternative explanation is a source of error which should be removed, or an integral part of the variable of interest.

The Shariff group seems to be saying that if children’s ungenerous behavior can be explained by their country of origin, it need no longer be attributed to their religion. But in a country like Turkey, where 99.8% of its citizens are Muslims, how can you separate its religion from the rest of its culture? In fact, statistically controlling for Turkish nationality precludes the possibility that the Muslim religion of its children will have any affect on the outcome of the study. Was this the right decision? (The situation in South Africa is less extreme, since only 80% of South Africans are Christians.)

An analogy may help. Suppose I do a survey of the gender gap in the salaries of U. S. adults. I statistically control for variables like age, socioeconomic status, education, work experience, etc., and I find that men are paid more than women for the same job. But suppose a critic maintains that tall people are respected more than short people, and therefore paid more. He argues that I am obligated to statistically control for the height of my respondents. Since men are on average taller than women, when I statistically eliminate the effect of height, the association between gender and salary disappears. Does this mean that women are not discriminated against in the workplace, but only short people are?

You might argue that this is a bad analogy because gender is a more plausible explanation for wage discrimination than height. But is nationality a more plausible explanation for lack of altruism than religion? Or did it only seem that way because the negative effect of religion on altruism was unexpected?

You may also be interested in reading:

More Bad News For Religion

The Political Uses of Fear

Auschwitz

This post returns to a theme I’ve discussed before: Events that evoke fear in the population, and the publicity given to those events, can cause conservative shifts in public attitudes and work to the advantage of right-wing politicians. In previous posts, I’ve reported on the effects of terrorist attacks and the spread of the Ebola virus. A new study by a group of Israeli and American psychologists headed by Daphna Canetti looks at the effect of reminders of the Holocaust on Israeli public opinion. As they point out, in spite of the passage of over 70 years, the collective trauma of the Holocaust is still a central component of Jewish identity, and Israeli politicians often refer to alleged “lessons” of the Holocaust.

In the first of four studies, a community sample of 57 Jewish Israelis was asked to complete a packet of questionnaires. They were randomly assigned to the Holocaust-salience condition or or one of two control groups. The Holocaust salience group was given this instruction:

Please think about the murder of six million Jews by the Nazis during the Holocaust. What thoughts do you have about the Holocaust? Please briefly describe the emotions that you have when you think about the murder of six million Jews during the holocaust.

In one control group, they were asked to think about “your personal death” rather than the Holocaust. In a second control group, the Holocaust was replace by “severe physical pain.” Subsequently, participants were asked to what extent they defined themselves as Zionists, and filled out an 11-item questionnaire measuring support for military rather than diplomatic solutions to Israel’s conflict with Iran, i.e., “Israeli Defense Forces should strike Iran’s nuclear facilities.”

The results showed that participants in the Holocaust-salience condition showed greater support for an aggressive foreign policy than participants in either the Death or Pain conditions, and that the effect of Holocaust salience on militancy was mediated by ideological support for Zionism. That is, Holocaust salience increased endorsement of Zionism, which in turn increased support for a militant foreign policy. (Please see this previous post for an explanation of how mediation is tested.)

Experiment 2 was designed to demonstrate that thinking about the Holocaust does not inevitably increase support for warlike solutions to problems. It depends on how the Holocaust is framed. Framing refers to the way in which information is presented. It involves selecting some aspects of a situation and making them more salient. For example, people are more likely to choose to have an operation if they are told that there is a 75% chance they will live than if they are told that there is a 25% chance they will die.

In this study, participants were assigned to either the Holocaust-Jewish condition, in which the Holocaust was framed as “a crime against the Jewish people,” the Holocaust-Human condition, in which it was described as “a crime against humanity,” or the Pain control group. In addition to the previous questions, participants were asked about their willingness to compromise in order to achieve peace with the Palestinians. The results showed that only the Holocaust-Jewish frame increased support for warlike policies toward the Iranians and the Palestinians, and once again, the effect was mediated by identification with Zionism.

The final two studies attempted to bring a touch of realism to the previous laboratory experiments. On January 27, Israel celebrates Holocaust Remembrance Day. At midday, a siren goes off and everyone is asked to stop whatever they’re doing and think about the Holocaust for a minute. There are also Holocaust-themed events and programs in the mass media. In Study 3, 157 participants completed a questionnaire about their participation in Holocaust Day activities. As expected, the greater their personal participation in Holocaust Remembrance Day, the greater their support for Zionism and a militant foreign policy.

It should be noted that this study does not support the claim that participation in Holocaust Remembrance Day causes pro-war attitudes. It is equally possible that more conservative Israelis participated in more Holocaust Day activities.

Study 4 was a survey of a representative sample of 867 Israeli Jews. Although the first three studies involved temporary increases in the salience of the Holocaust, the authors were also interested in long-term exposure to Holocaust imagery. Holocaust survivors and their descendants can be expected to think about the Holocaust more often than average Israelis. Therefore, they compared a Holocaust group, consisting of Holocaust survivors, or the children and grandchildren of Holocaust survivors, to a non-Holocaust group. The second variable was personal exposure to political violence. It was measured by asking participants whether they had suffered an injury to themselves, a family member or a friend as a result of a rocket or terror attack, or whether they had personally witnessed a terror attack or its immediate aftermath.

Neither Holocaust survival nor personal exposure to terrorism alone predicted attitudes toward war and peace, but those respondents who were both from Holocaust survivor families and had personal experience with political violence held Zionist attitudes, were more politically militant and were less willing to compromise for peace. The authors concluded that both short-term and long-term exposure to Holocaust imagery encouraged Israeli citizens to generalize from the Holocaust to Israel’s current conflicts with its neighbors, and to support aggressive military solutions to those conflicts.

It would be presumptuous of me to suggest what lessons Israelis should take from the Holocaust. However, it is not obvious that the only conclusion that follows from the Holocaust is that they should refuse to negotiate with their adversaries, or that they should engage in preemptive attacks on them. War crimes can sometimes be prevented by making peace.

In October 2015, Israeli Prime Minister Benjamin Netanyahu said in a speech that Adolf Hitler had not intended to exterminate the Jews, but that the idea had been personally suggested to him by a Palestinian, the grand mufti of Jerusalem. His comments were denounced by Israeli historians as a lie and a disgrace, but, given his current political stance, it’s easy to see why Netanyahu would want to encourage such a belief. If Canetti’s studies are widely publicized by the Israeli media, Israelis can be forewarned about the cynical misuse of Holocaust imagery for political advantage.

You may also be interested in reading:

Are Terrorists Getting What They Want?

Did Ebola Influence the 2014 Elections?

Deep Background

Teaching Bias, Part 2

Before continuing, please read Part 1 of this article.

Since people are usually not aware of their nonverbal behavior, nonverbal bias is a common feature of everyday life. As a result, families and friends routinely teach children racial and ethnic preferences without intending to. These biases are also taught through the mass media. A 2009 series of studies by Max Weisbuch and his colleagues, done with college students, demonstrates the teaching of implicit racial bias by television.

These researchers recorded 90 10-sec segments from 11 popular television programs in which White characters interacted with either White or Black targets. The clips were edited to eliminate the soundtrack and to mask the White or Black target to whom the character was talking. Twenty-three judges rated how positively the targets were treated. The (unseen) White targets were perceived as being treated more favorably than the (unseen) Black targets. This study established the existence of nonverbal racial bias on television. It seems unlikely that the actors and directors of these programs were aware that they were transmitting bias. These 11 shows had an average weekly audience of 9 million people.

The remaining studies were designed to test whether nonverbal race bias affects the viewer. In the second study, the 11 programs in Study 1 were scored according to the amount of race bias in the clips. The participants were asked which of these programs they watched regularly. It was found that watchers of the more biased programs showed a greater preference for Whites on the Implicit Association Test (IAT), a standard measure of implicit racial bias. (See this previous post for an explanation of the IAT.)

Since this is a correlational study, it does not demonstrate that exposure to biased programs causes prejudiced attitudes. An alternative explanation is that viewers prefer TV programs that reinforce their pre-existing attitudes. The remaining two studies, however, were true experiments in which participants were randomly assigned to be exposed to different televised content.

In these two experiments, participants were shown one of two silent videos constructed from clips used in Study 1. The pro-White tape featured White targets receiving positive nonverbal signals and Black targets being treated more negatively. The pro-Black tape featured favorable treatment of Black targets and unfavorable treatment of Whites. The participants were then tested for implicit racial bias. In Study 3, the IAT was used as the measure of bias. As expected, those who had seen the pro-White video showed a greater preference for Whites than those who had seen the pro-Black video.

Study 4 involved a different measure of implicit racial bias, an affective priming task. This task measures whether subliminal exposure to photos of White and Black faces speeds up the recognition of positive or negative images. Subliminal means below the level of awareness. Photos are presented on a computer so quickly that they are not consciously perceived. Nevertheless, they influence behavior. The premise, well established through previous research, is that you respond more quickly to an image if it is preceded by another that elicits a similar emotional response. Therefore, if you are subliminally exposed to a photo of a liked person, you can recognize a positive object, i.e., a puppy, more quickly, while exposure to a disliked person allows you to identify a negative object, i.e., a rattlesnake, more quickly.

This experiment was strengthened by some additional controls not present in Study 3. In addition to pro-White and pro-Black videos, there was a race-neutral control video. Photos of White, Black and Asian-Americans were used as subliminal primes. The results are shown below.

A higher number on the vertical axis indicates a faster response to that prime. The people who had seen the pro-White video showed faster positive associations to White faces (compared to Black faces), while those who had seen the pro-Black video showed faster positive associations to Black faces (compared to White faces). The control video had the same effect on both Black and White associations. Asian faces had no priming effect.

The studies cited in these posts make it clear that we don’t have to be explicitly taught to like or dislike members of different racial or ethnic groups. Our social environment contains nonverbal cues which encourage the reproduction of prejudice and discrimination from one generation to the next.

You may also be interested in reading:

What Does a Welfare Recipient Look Like?

Racial Profiling in Preschool

A Darker Side of Politics