Not surprisingly, the gap between rich and poor is increasing. The top 1% owned “only” 29.9% of the nation’s wealth in 1989.
After declining slightly due to the great recession of 2008, the wealth gap between Blacks, Whites and Latinos is increasing again. Mean White family wealth is now greater than it was in 2007, but Blacks and Latinos have not yet recovered from the recession. (By the way, if these dollar amounts seem high, remember that they are means, which are skewed by the wealth of those at the top. The medians are much lower.)
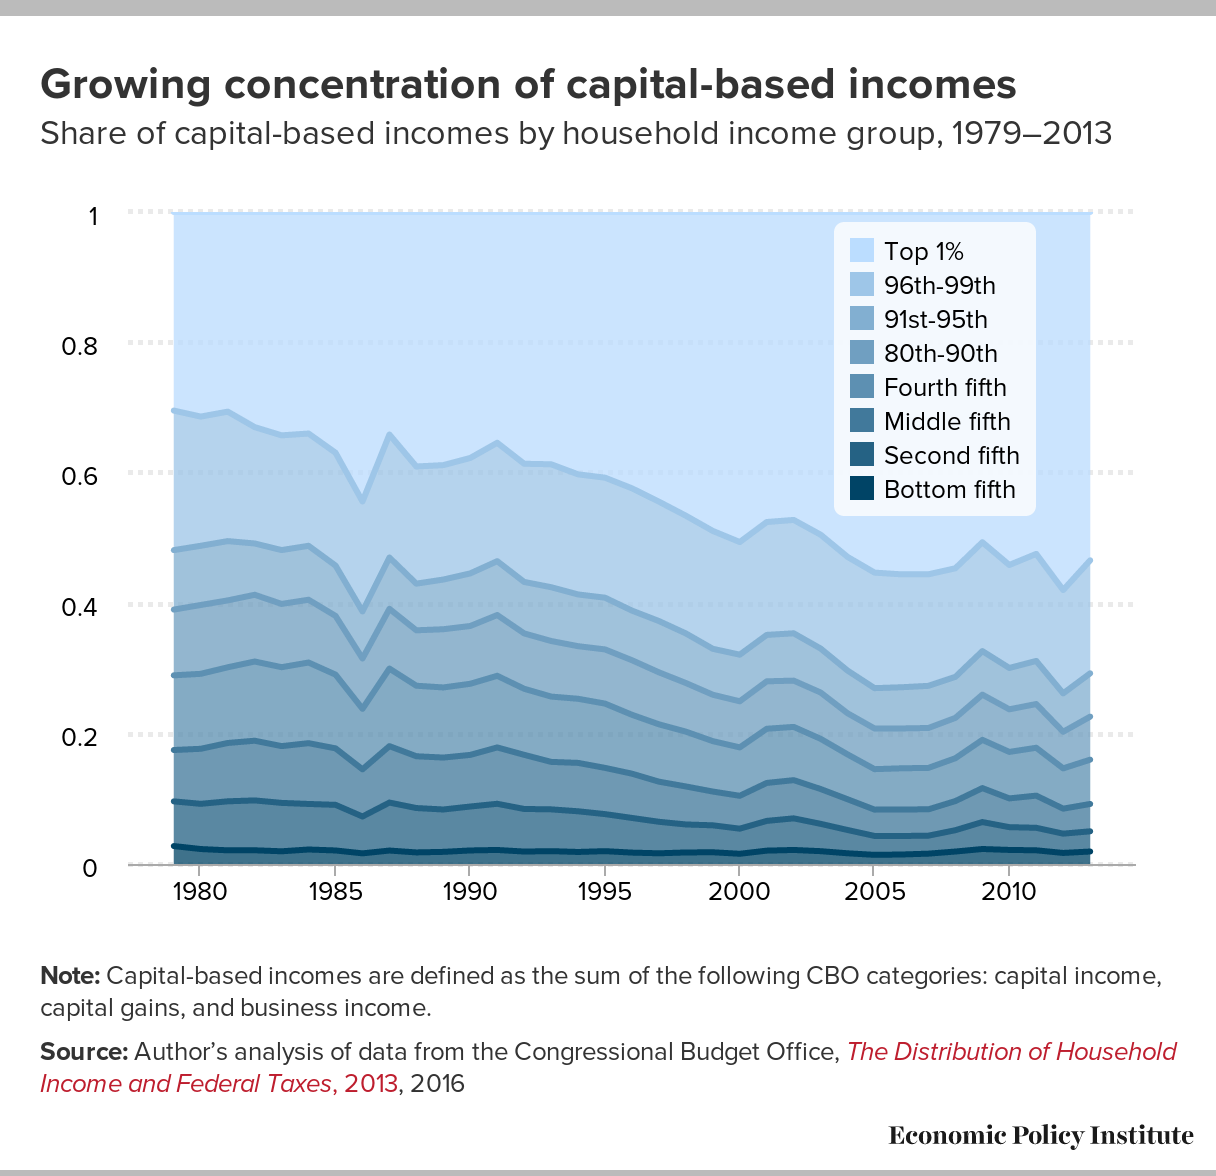
This provides an interesting backdrop for the Republican Tax Plan, which cuts the top individual tax rate from 39.5% to 35%, and reduces the corporate tax rate from 35% to 20%. (Since capital-based income is concentrated among the rich, a corporate tax cut is simply another tax cut for the rich.) It also eliminates the estate tax. To partially pay for these giveaways, the President proposes cuts of $4.3 trillion to Social Security, Medicaid, public education and other non-military spending. The House Republican budget calls for a $5.8 trillion cut in these same programs.
The corporate media seem to have accepted Donald Trump’s emphasis on the economic problems of working class Whites. This ignores the fact African-Americans experience more of these same stressors, as we are reminded in this video from the centrist think tank, the Brookings Institution.
None of these statistics–with the exception of the marijuana arrest rate–tell us whether the problems of Black Americans are a result of racial discrimination or some other cause. However, we can be fairly confident that when Whites experience the same difficulties, they are not a result of discrimination.
It is one of the happy incidents of the federal system that a single courageous state may, if its citizens choose, serve as a laboratory; and try novel social and economic experiments without risk to the rest of the country.
It looks as though we are about to once again embark on a national program of deregulation, tax cuts for the wealthy, and austerity for everyone else. So how has that worked out so far? Economist Robert Reich explains.
Social psychologist Donald Campbell, in a 1969 paper entitled “Reforms as Experiments,” argued that we ought to try out various social policies, carefully evaluating the results, and repeat only those that are successful. Of course, Reich’s comparison is not really an experiment. California, Kansas and Texas were not randomly assigned to conditions of austerity or public investment, and even if they had been, there were many pre-existing differences between the three states. Nevertheless, prevailing evidence argues strongly against conservative economics and in favor of public investment as a long-term strategy.
The people who benefit least from American capitalism are mostly likely to be killed or maimed defending it, according to a new paper entitled “Invisible Inequality: The Two Americas of Military Sacrifice” by political scientist Douglas Kriner and law professor Francis Shen. And it wasn’t always that way.
The centerpiece of their investigation is a study of the socioeconomic status of American soldiers killed or wounded in World War II, Korea, Vietnam, and the Iraq/Afghanistan wars. Of course, the Pentagon does not provide such data, but they do list the home towns of the dead and wounded. The authors determined the median family incomes in the home counties of each casualty. Obviously, this introduces “rounding error” into the data, but it gives valuable information about whether the dead and wounded come from richer or poorer parts of the country. Here are the data for fatalities, with the median incomes adjusted to reflect dollars from the year 2000.
Clearly, as the U.S. has come to rely less on the draft and more on other forms of recruitment, what was once shared sacrifice has become more unequal. The results for non-fatal casualties are quite similar.
The authors attribute these results to two processes. The selection mechanism refers to differential selection into the armed forces of young people whose economic opportunities are limited, making them responsive to financial incentives the military offers. The sorting mechanism refers to the assignment of lower socioeconomic status soldiers to higher risk positions in the military, since they lack the education or job skills that would make them more useful away from the front lines.
It has been noted that soldiers injured in Iraq and Afghanistan have a higher survival rate than in previous wars, but return home with more serious injuries. This means that inequality continues long after the war. The authors note several studies showing that social class is an important factor affecting the health outcomes of veterans. Veterans from poorer counties return to communities with fewer resources to help in their readjustment, and their injuries place an additional financial burden on those communities.
Kriner and Shen did a national survey showing that only about half of the public is aware of these inequalities. They asked the following question of a national sample: “Thinking about the American soldiers who have died fighting in Iraq and Afghanistan, what parts of the United States do you think they are coming from?” The alternatives were more from richer communities, more from poorer communities, or equally from richer and poorer communities. Forty-five percent believed that the sacrifice was shared equally, while 44% realized that poorer communities carried a larger part of the burden.
Finally, they did two web-based experiments measuring how Americans react to correct information about military inequality. In one of these, half the respondents were told that many more of the Iraq and Afghanistan fatalities came from socioeconomically disadvantaged communities, while those in the control group were not given this information. Fifty-six percent of those in the control group said the invasion of Iraq was a mistake, compared to 62% given information about inequality of sacrifice. A similar result was obtained in a second study measuring willingness to engage in future wars. As the authors state, “The invisibility of casaulty inequality artificially inflates public support for war and the leaders who wage it.”
We know from attribution theory that if the public believes that people in the armed forces freely chose to serve out of personal motives such as patriotism, rather than being driven by environmental forces such as economic necessity, they are more likely to be held responsible for the outcomes of their decisions. Thus, the invisibility of military inequality may contribute to tendencies to blame these vicitims for their deaths or injuries, since they “freely chose” to enlist.
A recent headline says that climate change will cost the millennial generation $8.8 trillion. But from where does this number come? The trail leads to a 2015 study by Marshall Burke of Stanford University and two colleagues from the University of California at Berkeley in which they attempted to measure the relationship between temperature and economic productivity.
We know that global temperatures are increasing, and we can estimate how much they will increase if nothing is done to mitigate climate change (the “business-as-usual” scenario). How can you measure the relationship between temperature and economic productivity? You can’t do it simply by comparing the economies of warmer and cooler countries, since there are many cultural and environmental differences between, for example, Sweden and Nigeria. But if you compare the productivity of each country during warmer- and cooler-than-usual years, each country serves as its own control group.
However, other variables that influence the economy may take on different values during warmer and cooler years. For example, a global trade agreement may have increased productivity in certain countries in certain years, and those years may also have happened to be warmer (or cooler). These confounding variables have to be measured and statistically removed from the data.
Burke and his colleagues gathered data from 166 countries over the 50-year span between 1960 and 2010. They used multiple regression to calculate the relationship between temperature and productivity, while eliminating the effects of “common contemporaneous shocks,” such as global price changes or technological innovations, “country-specific . . . trends in growth rates,” such as those produced by changing political institutions or economic policies, and the lagged effects of previous years’ temperature and rainfall. Their final curve is an average of the impact of temperature on productivity in the 166 countries, weighted by the countries’ population size.
They found that the relationship between temperature and productivity is a curve which peaks at 55 degrees Fahrenheit (13 degrees Celsius). That is, countries are most productive when their average annual temperature is 55 degrees, and their productivity declines the more the average deviates from that temperature in either direction. The curve is shown below, along with the average yearly temperatures of selected countries. The blue shaded area represents the 90% confidence interval around their best estimate. At right are separate breakdowns for rich and poor countries, years of measurement, and agricultural and non-agricultural productivity.
Next, they used this relationship to calculate the effects of expected future climate change, assuming business-as-usual, on future global income and the incomes of each country. The model predicts that global productivity will decline approximately 23% by 2100, as compared to the same future without global warming. While some cooler-than-average countries, such as Canada and Russia, will see their economies improve, the majority (77%) will see declines in income, especially those countries near the Equator. Since the countries that can anticipate the worst effects are already poorer than average, the result will be an increase in global inequality. Here is a brief presentation of their findings by Dr. Burke.
How can these results be explained? The authors found that agricultural productivity peaks at around the same temperature (see the chart above). They also mention increased energy costs and declines in health at warm and cool temperatures. Finally, they cite research showing that human cognitive errors and interpersonal conflicts increase at warmer temperatures.
Can we trust these predictions? An optimist might note that there is a danger of overestimating the damage climate change will cause if the peak in productivity at 55 degrees is actually due to confounding variables unrelated to temperature that are not controlled in their analysis. However, it’s difficult to think of phenomena not caused by temperature that would still produce a productivity curve peaking at 55 degrees.
The authors also point out that between 1960 and 2010 annual temperatures fluctuated fairly randomly. This provided little incentive for people to adapt to warmer or cooler temperatures. However, future temperatures are expected to increase consistently, which may instigate successful efforts to adapt to these warmer temperatures.
Optimists might also argue that the assumption of no climate action at all between now and 2100 is unrealistic. To the extent that effective action is taken to mitigate climate change, the loss of productivity will not be as great.
On the other hand, a pessimist could think of reasons why their analysis might underestimate climate change’s damage to the economy. The authors note that their model focuses only on the effects of temperature and those other phenomena that are directly influenced by temperature. But climate change will affect other things besides temperature, such as sea level rise and extreme weather events. If these other effects reduce productivity, the harm due to climate change will be greater than they predict.
They also note that their model predicts the effects of annual temperatures only within the range that they have been observed between 1960 and 2010. But if global temperatures increase substantially, the future may not be predictable from the past. For example, if temperature increases cause sustained droughts over large areas, the cumulative effects on agricultural productivity may be much greater than the effects of any known previous droughts. In reality, we probably have little idea of what future catastrophes await us.
We can now return to the effect of climate change on the incomes of millennials. Two nonprofits, Demos and NextGen Climate, have published an analysis of the lifetime cost of climate change to American millennials, using the data from Burke and his colleagues. The Burke analysis predicts that, in the absence of climate action, the United States economy will shrink 5% by 2050 and 36% by 2100—slightly more than the global average of 23%.
Millennials are typically defined as people born between the early 1980s and the early 2000s. The Demos/NGC paper calculated the lifetime earnings lost by Americans who turned 21 in 2015 (born in 1994) and those born in 2015. This is simply a matter of arithmetic, and the formulas are given in their appendix. Using these formulas, you can calculate the cost of climate change to any birth cohort. Obviously, the later the birth year, the greater the cost. The $8.8 trillion figure is the aggregated cost to all millenials.
The chart below illustrates the average cost of climate change to Americans turning 21 in 2015, calculated separately for college graduates and non-graduates.
The second chart compares wealth lost by 2015 college graduates due to climate change to two other drains on the income of their generation—college debt and the lingering effects of the Great Recession.
Of course, the accuracy of these figures depends entirely on the validity of the analysis by Burke and his colleagues.
This post is for those of us who are bothered by all the time we waste in the doctor’s waiting room. Our annoyance is explained by the economic concept of opportunity cost. Opportunity cost refers to the other more productive and/or enjoyable things we could be doing with this lost time.
Kristin Ray and her colleagues attempted to measure the opportunity cost of a doctor visit. Their two studies (here and here) are summarized in this video.
Wouldn’t it be great if more researchers posted short videos like this one summarizing the results of their research?
Here are a couple of loose ends I’d like to clear up:
Measuring opportunity cost is simpler for the employed people in the sample, since they were asked to report their hourly wages. For those not employed, demographic variables (age, sex, education, etc.) were used to estimate their hourly wages, which were then adjusted for the probability that someone in their demographic category would be employed. Bottom line: The researchers assume that the time of non-employed people is less valuable. (Some of us might want to contest that assumption.)
If you’re puzzled by their estimate of $32 as the average cost of a doctor visit, note that this is the out-of-pocket cost. The average real cost was $279, but most of it was paid by insurance.
The extra 25 minutes spent by minorities and unemployed people was not explained by length of time spent face-to-face with the doctor, and their travel time was only slightly longer. Most of it was extra time spent in the waiting room. This suggests that these folks go to doctor’s offices that are more crowded or that schedule their patients less efficiently.
I’m not optimistic about the potential to remedy this situation because, with the possible exception of those who cater to the wealthy, I don’t see that physicians have much incentive to make their services more user-friendly.
We live in a market economy. We are frequently exposed to reminders of money. Does living under capitalism change our behavior? In a classic paper, social psychologists Margaret Clark and Judson Mills distinguished between communal relationships such as those that exist between family members and friends, and exchange relationships such as those that occur in business. Different norms apply to these two types of relationships. For example, people in an exchange relationship keep track of each other’s inputs into a joint task, while people in a communal relationship keep track of each other’s needs.
Several studies suggest that leading participants to think about money changes their behavior in predictable ways. These studies use cognitive priming to create subtle reminders of money. For example, participants may be asked to unscramble words into meaningful sentences. In one condition, all the sentences just happen to be about money, while in another condition they are about something else. In general, thinking about money increases achievement on difficult tasks, but decreases altruism or helping behavior.
In the latest contribution to this research, Agata Gaslorowska and her colleagues report four experiments done with Polish children aged 3 to 6. The priming manipulation was a sorting task. The children in the money condition were asked to sort 25 coins into three different denominations. Those in the control group sorted nonmonetary objects, such as buttons or hard candies.
Two of the experiments involved motivation and performance. In one of them, children who had handled money were more likely to complete a difficult labyrinth puzzle than those in the control group. In the second, those in the money condition spent a longer time working at what was essentially an insoluble task, a jigsaw puzzle intended for older children.
The other two studies involved willingness to help another child. In the third experiment, children were given an opportunity to help by bringing the child red crayons from across the room. Those who had sorted money brought fewer crayons than those in the control group. The final study measured self-interested behavior as well as altruism. As a reward for being in the study, the children were allowed to choose up to six stickers for themselves. Those who had handled money took more stickers. Then the children were asked if they would donate some of their stickers to another child who had not participated in the study. Those in the money condition donated fewer of their stickers. The results are shown below.
For each percentage of stickers donated, the graph shows the percentage of children in that condition who donated at least that percentage of their stickers. It should be noted that sorting candies put the children in a better mood than sorting buttons or coins, but mood was unrelated to helping in this experiment.
These experiments show that thinking about money affects the behavior of 3 to 6-year-old children in ways that are similar to its effects on adults. These kids had only a limited understanding of money. For example, they were unable to identify, at better than chance, which coin would buy the most candy. Nevertheless, they were aware enough of the function of money for it to change their behavior.
One of the authors of the study, Kathleen Vohs, proposes that the unifying thread in all these money studies is that thinking about money causes people to place a greater value on self-sufficiency. In another of her studies, adults primed with thoughts of money were more likely to choose to work alone rather than with another participant. If it’s good to be self-sufficient, this could explain why people in need are seen as less deserving of help.
Sociologist Robert Putnam, in his book Bowling Alone, presents data suggesting that over the last 50 years, Americans have engaged in fewer group and community activities and more solitary ones, with the result that we are less cooperative and trusting. Ironically, Putnam uses a market metaphor to summarize his theory. He says the disintegration of communal relationships reduces social capital, giving society fewer resources that can be used for the public good in times of need.
Michael Sandel, a political philosopher, argues that we have gone from having a market economy to being a market society. Public goods are increasingly privatized and virtually everything is for sale if the price is right. He summarizes his critique in this TED talk.
Since most of us have never lived under any other economic system, we are largely unaware of how capitalism affects our behavior. However, some of us spend more time handling and thinking about money than others. In one study, college students majoring in economics behaved less cooperatively in a bargaining game than students majoring in other fields. Studies consistently show that poor people are more generous and helpful than rich people.
These studies have something to appeal to people of all political persuasions. Conservatives will no doubt be pleased to learn that thinking about money encourages hard work and achievement. On the other hand, the finding that the market society replaces helpfulness with selfishness confirms an important part of the liberal critique of capitalism.
So far, we have no evidence that the killers were directed by a terrorist organization overseas or that they were part of a broader conspiracy here at home. But it is clear that the two of them had gone down the dark path of radicalization, embracing a perverted interpretation of Islam that calls for war against America and the West.
In Sunday night’s televised address, President Barack Obama claimed that the threat of terrorism “has evolved into a new phase”—that of home-grown terrorists inspired by ISIS, but not acting at the direction of the ISIS leadership. Although the U.S. military and law enforcement have grown more successful at preventing “complex and multi-faceted attacks like 9/11,” terrorists are turning the “less complicated acts of violence,” such as mass killings. However, when Obama spoke about the steps we are going to take to fight this new threat—more bombing of Syria and Iraq, tighter security, etc.—they turned out to be more of the same policies we have already implemented to fight the old form of terrorism. Maybe that’s why Obama describes desribed this home-grown terrorism—in what may be the most memorable line of the speech—as “a cancer that has no immediate cure.”
The future of Muslim terrorism in this country will depend not only on whether we abandon our seemingly endless war to control Middle Eastern energy resources, but also on social and economic conditions here at home. Home-grown Muslim terrorism has many of the same causes as non-Muslim domestic terrorism. Since 9/11, 48 people have been killed by right wing extremists and 28 by Muslim extremists. Our success in preventing both types of murder will depend on our being able to maintain the loyalty of working class Americans at a time of increasing inequality.
I’ve previously discussed Thomas Piketty’s claim that economic inequality is an important cause of Middle Eastern terrorism. Alvaredo and Piketty attempted to measure the extent of inequality in the Middle East, a task made more difficult by the lack of accurate data. They estimate that the top 10% controls over 60% of Middle East income, while the top 1% controls over 25%. Although the average income in the United States is much higher, income inequality in the U.S. is almost as high as in the Middle East. (In the U.S., the top 1% takes in 23% of the income.) A large body of evidence shows a positive relationship between income inequality and violence. For example, the homicide rate is higher in more unequal countries, and income inequality also predicts differences in the homicide rates of U.S. states. It now appears that our bleak economic conditions are starting to influence the overall death rate.
There has been a long-term decline in U.S. mortality rates, making our lives longer and better. However, Princeton economists Anne Case and Angus Deaton report that between 1999 and 2013, there was a reversal of this trend for non-Hispanic whites aged 45-54. While from 1978 to 1998, the mortality rate for this group declined by about 2% per year, since 1999, it has been increasing by about .5% per year. This translates into 96,000 more deaths than if the mortality rate were flat, and almost 500,000 more deaths than if it had continued its 2% per year decline. Described by the authors as a surprise, this startling increase in deaths has received little attention from the corporate media (although I suspect life insurance companies are on red alert). The closest recent parallel is the increase in deaths in Russia after the fall of the Soviet Union. As Joe Biden might say, “This is a big f***ing deal!”
The reversal is specific to this middle-aged whites. Mortality rates for blacks, Hispanics, and older whites continued to decline. The mortality rate for Hispanics aged 45-54 (262 per 100,000) is lower than that of middle-aged whites (262 v. 415 per 100,000) and declined by 1.8% over the 14 year period. The mortality rate for middle-aged blacks is higher (582 per 100,000), and declined at a rate of 2.6% per year. (To put this in perspective, middle-aged whites now die 71% as often as middle-aged blacks, compared to 56% as often 14 years ago.)
The increase in mortality among middle-aged people is also specific to this country. The graph below compares U.S. whites to the same age group among U.S. Hispanics and the residents of six other industrialized countries. (Both the authors of the study and the New York Times chose to include U.S. Hispanics in this table, but not U.S. blacks. If they had included blacks, of course, they would have needed a much larger graph.)
This is largely a story about social class. Since they didn’t have income data, the authors used education as a substitute. The change was most pronounced among those with a high school education or less. Mortality in this subgroup rose by 22% over the 14-year period, while it remained stable among those with some college and declined for those with a college degree.
The immediate cause seems to be an increase in self-destructive behavior. The change is explained almost exclusively by increases in three causes of death—suicide (up 78%), accidental drug and alcohol poisoning (up 400%), and cirrhosis and other chronic liver diseases caused by alcoholism (up 46%). These folks are committing either rapid or slow suicide.
There was also an increase in morbidity, or poor health, in this subgroup. The percentage reporting themselves in good health declined, and more people reported chronic pain, serious psychological distress, and difficulty in carrying out the activities of daily life, such as walking or socializing with friends. This is consistent with reports of increases in white, middle class drug overdoses caused by overuse of pain medication. (Ironically, the increase in opiate addiction among whites may lead to a more humane drug policy.) Self-reported alcohol consumption also increased. The increased mortality is not explained by obesity, since it occurred at about equal rates for obese and non-obese people.
Case and Deaton attribute these changes to the decline in the standard of living and increasing economic insecurity among middle-aged whites. Deaton suggested in an interview that whites have “lost the narrative of their lives”—that is, they must face the reality that they are unlikely to have a financially secure retirement. A non-college graduate who was 50 in 2013 was born in 1963, and entered the work force around 1981, just about the time that the American corporate class began its relentless assault on the living standards of middle class Americans. The real median hourly wage for white men with no more than a high school diploma declined from $19.76 in 1979 to $17.50 in 2014. The Pew Research Center reports that the percentage of Americans in the middle class, defined as an income between two-thirds and double the national median ($42,000 to $126,000 for a family of three), has declined from 61% in 1971 to 50% in 2015.
Of course, some of these economic trends have occurred in other developed countries as well, but the U.S. has a less adequate social safety net and has neglected its infrastructure. Case and Deaton note that most workers in the U.S. have been forced into defined-contribution retirement plans, while in other industrialized countries, defined-benefit plans are the norm. Defined contribution 401(k) plans shift all of the risk of stock market losses onto the employee. The average wealth of middle-income families declined from $161,000 in 2007 to $98,000 in 2010, where it still stands today.
I realize Case and Deaton have documented distress among middle-aged whites, while terrorists, both white Christian and Muslim, are usually (but not always) younger. My argument assumes that increasing mortality among 45-to-54-year-olds is a cumulative result of economic stress that began at an earlier age, and that anxiety about the future is spreading to younger generations. For example, a poll by Harvard’s Instiute of Politics found that 48% of 18-to-29-year-olds believe that the “American dream” is “dead,” while 49% think it’s “alive.”
 Not surprisingly, the gap between rich and poor is increasing. The top 1% owned “only” 29.9% of the nation’s wealth in 1989.
 This provides an interesting backdrop for the Republican Tax Plan, which cuts the top individual tax rate from 39.5% to 35%, and reduces the corporate tax rate from 35% to 20%. (Since capital-based income is concentrated among the rich, a corporate tax cut is simply another tax cut for the rich.) It also eliminates the estate tax. To partially pay for these giveaways, the President proposes cuts of $4.3 trillion to Social Security, Medicaid, public education and other non-military spending. The House Republican budget calls for a $5.8 trillion cut in these same programs.


 For each percentage of stickers donated, the graph shows the percentage of children in that condition who donated at least that percentage of their stickers. It should be noted that sorting candies put the children in a better mood than sorting buttons or coins, but mood was unrelated to helping in this experiment.

You must be logged in to post a comment.