When we think about the current situation in Washington, it’s hard to believe that government can ever provide efficiently for the needs of the majority of our citizens. Yet, obviously, it doesn’t have to be this way. Other countries seem to manage. For example, a July 2017 study by the Commonwealth Fund compared the United States health care system to ten other high-income countries.
This chart plots health care spending (left to right) in relation to health care performance (top to bottom), an index which combines five dimensions—care process, access, administrative efficiency, equity, and health care outcomes. As you can see, we spend far more on health care that the other countries, yet we have poorer health outcomes. While life expectancy in the U. S. had been improving for several decades, it is now declining in some populations, in part due to the opioid crisis.
As an illustration of how things could be different, I recommend taking six minutes to watch this video by Joshua Holland, with animation by Rob Pybus, comparing life in Denmark, the second happiest country in the world, to life in the United States, the 15th happiest.
You may have noticed that this post has the same theme as Michael Moore’s 2015 documentary film, Where to Invade Next. For a longer (and funnier) look at what we can learn from the rest of the world, I highly recommend it.
Over the course of the 25 years or so that I taught Environmental Psychology, the section of the course about actions students could personally take to help preserve the environment gradually grew shorter and eventually faded away. It was just too embarrassing. There was plenty of research on how to encourage behaviors such as recycling and energy conservation, but the payoff from these actions was so small that emphasizing them seemed to trivialize the problem of climate change. The authors of the current study have broken free of the trap of emphasizing only trivial behavior changes and have included in their research some actions that will really make a difference.
Seth Wynes, a geographer from the University of British Columbia in Canada, and Kimberley Nicholas of the Centre for Sustainability at Lund University in Sweden, analyzed 148 scenarios from 39 sources—peer-reviewed papers, government reports, and carbon footprint calculators—which estimated the effectiveness of a dozen actions that individuals could take to reduce their carbon footprint. A carbon footprint is a measure of the total greenhouse gas emissions caused directly or indirectly by a person over the course of his or her lifetime.
They confined their analysis to studies done in developed countries, since their carbon consumption is a greater danger to the climate. They assumed that the individual showed total compliance with the behavior change, even though partial compliance was possible for some actions, i.e., switching to a plant based diet. For purposes of analysis, all estimates were converted to a common metric, tons of CO2 equivalent (tCO2e) per year per individual. They then calculated the mean estimate of all available studies of each behavior.
The authors identified four recommended actions that would have high impact, defined as saving more than .8 tCO2e per individual per year. In order of importance, they are:
A fifth behavior, switching to green energy, was not recommended due to the authors’ lack of confidence in estimates of its effect. However, the mean savings met their criterion for high impact and they included it on their chart. The remaining behaviors they analyzed were found to have either moderate or low impact.
In a second analysis, the authors tabulated the individual actions recommended in ten high school textbooks widely used in Canada, and in the official government publications of Australia, Canada, the European Union and the United States. Having fewer children and eating a plant-based diet were not mentioned in any textbook; avoiding air travel was mentioned twice and living car free five times. Textbooks emphasized behavior with moderate impact, i.e., conserve energy, or low impact, i.e., plant a tree, or behaviors whose impact could not be estimated, i.e., “raise awareness,” a textbook favorite.
The analysis of government publications produced similar results. Having fewer children and eating a plant-based diet were also not mentioned in any government publications; avoiding air travel was mentioned twice and living car free once. Most of the recommended actions were of moderate impact, such as using public transportation and buying energy-efficient products. Both the textbook publishers and the four governments avoided recommending politically unpopular actions that might cut into corporate profits.
This study is obviously not the last word on reducing carbon usage. The authors admittedly did not attempt to measure rebound effects, in which reduced consumption in one area leads to increased consumption in the same or another area, i.e., knowing you have a more fuel-efficient car, you decide to drive more. Estimates of the impact of some of these actions varied quite a bit, indicating that they may not be completely reliable. The result of the most important behavior, having one fewer child, was based on a single analysis, albeit a solid, peer-reviewed study which assigned one half of a child’s emissions to each parent, one-quarter of each grandchild, and so forth.
Nevertheless, there are good reasons to take this analysis seriously. The differences between the impacts of these behavior changes are considerable. For example, the impact of a couple’s decision to have one fewer child was the equivalent of a lifetime of conscientious recycling by 684 individuals. This suggests that the authors have probably listed them in about the correct order, and that the distinction between low, moderate and high impact choices is real and important.
Researchers have estimated that, if we are to keep warming of the planet below 2° C, per capita emissions must be reduced to an average of 2.1 tCO2e per year by 2050. Wynes and Nicholas report that a person who eats meat and takes one transatlantic flight has used up 2.4 tCO2e, overshooting his or her personal carbon budget by these two actions alone. The current generation of teenagers are not being adequately prepared for the drastic behavioral changes that will be required of them.
Americans are used to the intense partisan divisions over many political issues—abortion, gun control, health care, economic policy, and so forth. However, education has largely escaped from partisan debate. Although Democrats and Republicans may squabble about how much money to spend on education, and how education is to be delivered, it has always been part of the conventional wisdom that education itself is valuable to the individual and the society. Thus it was surprising to read this headline from a new poll from the Pew Research Center: “Republicans increasingly say colleges have negative impact in U. S.”
The data come from a national survey of 2504 adults conducted June 8-18, 2017. Respondents were asked whether they thought each of five institutions—churches, banks, labor unions, the news media, and college and universities—have “a positive or negative effect on the way things are going in the country.” Here are the results comparing Republicans and Republican-leaners vs. Democrats and Democratic-leaners.
Although partisan differences of opinion on the value of labor unions and the news media were anticipated, differences in approval of colleges and universities were just as large. Moreover, partisan differences over the effects of colleges have increased sharply in the last two years. Here are the time trends.
The change is almost entirely attributable to Republicans. Although Democratic attitudes toward colleges have remained stable, Republican attitudes have shifted dramatically in the negative direction. As recently as 2015, 54% of Republicans said colleges had a positive impact on society and 37% said their impact was negative.
Furthermore, this negative shift among Republicans cannot be attributed exclusively to those who have not gone to college. Unlike their Democratic counterparts, Republican college graduates are slightly less likely to give colleges and universities positive ratings. This would seem to suggest that negative personal experiences may have played a role in their dissatisfaction.
The Pew survey is silent about the reasons for this change in opinion, so I guess I’m free to speculate. First of all, we should remember that there has been considerable partisan realignment in the last decade. Therefore, this result could be due as much to the migration of people who dislike colleges into the Republican Party as to attitude change toward colleges among people who were Republicans all along.
A second explanation may be the negative publicity colleges and universities have received due to excessive drinking (sometimes leading to deaths), increases in reported sexual assault, and attempts to censor campus speakers (although the public should be aware that most of the censorship takes place silently during the preparation of the guest list, rather than afterwards). However, much of the pushback against campus disciplinary action against accused rapists is coming from Republicans, and it is wealthy alumni that consistently oppose crackdowns on fraternities that encourage underage drinking. Therefore, some of the objections may be to the punishment of offenders rather than to the offenses themselves.
A third possibility is that Republicans are objecting to the knowledge produced by college and university faculty rather than campus social policies. Although Stephen Colbert may claim he was joking when he said that “Reality has a well-known liberal bias,” it is almost certainly true that more of the scholarship coming out of both the natural and social sciences contradicts Republican policies than supports them. This has generated well-organized and financed resistance from business interests, especially fossil fuel corporations whose future profitability is threatened by climate change. Although Shawn Otto gave his book,The War on Science, a nonpartisan title, the text makes it clear that the war is being waged by churches, business groups and Republican party operatives. Chris Mooney gave his similar book a more candid title: The Republican War on Science.
Regardless of the reasons for this attitude change among Republicans, it poses a threat to the continued funding of public colleges and universities. The university system in which I taught has seen a sharp drop in state funding over the past 30 years.
The middle and lower class young people for whom the State System of Higher Education (SSHE) was intended have largely been priced out of the market. Enrollment is dropping (for this and other reasons). A private consulting firm hired by the state of Pennsylvania—without student or faculty input—has recommended reorganization that will almost certainly involve cutbacks in programs and downsizing of the system. Meanwhile, SSHE has announced a 3.5% tuition increase for next year, as the system continues to circle the drain.
John Tumpane is a hero. On Wednesday, June 28, this Major League Baseball umpire was crossing the Roberto Clemente Bridge on his way to PNC Park in Pittsburgh, where he was to call ball and strikes in the Pirates’ game against the Tampa Bay Rays that night. He spotted a 23-year-old woman who had climbed over the railing and was looking down at the Allegheny River. As it turned out, she intended to commit suicide. Mr. Tumpane calmly attempted to talk her out of it, and eventually, with the help of some other passers-by, physically restrained her from jumping while another bystander called 911.
Believe it or not, an umpire is applauded at PNC Park.
Mr. Tumpane received a standing ovation at PNC Park the following night, and the story received both local and some national attention in the news media, including a front-page article in the Pittsburgh Post-Gazette the following day, quoting Dr. Christine Moutier of the American Foundation for Suicide Prevention saying that he did all the right things. From the perspective of social psychology, the important point is that he didn’t fall victim to the bystander effect.
The bystander effect does not refer to the failure of bystanders to intervene in an emergency. It refers to the paradoxical finding that the greater the number of bystanders, the less likely and more slowly they are to intervene. Two social psychologists, John Darley and Bibb Latane, read about the 1964 murder of Kitty Genovese in New York City. It was originally reported that 38 people had witnessed the assault, yet no one intervened or called the police for 35 minutes. Darley and Latane hypothesized that the large number of bystanders was the key to understanding their failure to take action, and initiated a research program demonstrating that helping declines as group size increases. Researchers have recently concluded that the original news reports of Ms. Genovese’s death were exaggerated. Not all 38 people actually witnessed the murder and some of them called the police sooner than was originally reported. Nevertheless, the bystander effect has been replicated in dozens of studies.
Kitty Genovese and her Queens, New York neighborhood.
It’s not that surprising that bystanders fail to intervene. As Darley and Latane point out, a bystander must successfully work through five steps before intervention can take place. He or she must:
Notice the event
Interpret it as an emergency
Assume responsibility
Know the appropriate form of assistance
Implement a decision to help
The presence of others can interfere at any of these steps, but particularly the second and the third, where bystander intervention can be inhibited by either pluralistic ignorance or diffusion of responsibility.
Pluralistic ignorance. Is this really a suicide attempt, or is the young woman just clowning around? It would be embarrassing to make a fool of oneself by overreacting to a benign event. When in doubt, we look to other bystanders for cues to their interpretation of the situation. But they may also be trying to appear outwardly calm, looking to us for information. As a result, the bystanders could fall victim to pluralistic ignorance, in which a group of people arrive at a definition of the situation that is different from their individual first impressions. They may come to believe that nothing is wrong because no one else looks concerned.
We know from the newspaper article that Mr. Tumpane was initially uncertain about whether he was witnessing an emergency. He asked a couple in front of him, “What’s this lady trying to do?” and they said, “I don’t know.” Fortunately, this did not deter him from interpreting the situation as a possible emergency.
Diffusion of responsibility. We don’t know how many people were on the Clemente Bridge that afternoon. The article says it was “mostly empty.” This may have helped Mr. Tumpane to avoid diffusion of responsibility. If only one person had been aware of the emergency and failed to intervene, he or she might be considered responsible for the woman’s death. But the greater the number of bystanders, the more responsibility is diffused, or spread out, among the witnesses. With many bystanders, no one feels responsible.
Since there were at least a few other bystanders on the bridge that afternoon, we can credit Mr. Tumpane with taking the lead in assuming responsibility. He also knew how to help a person in distress and did so skillfully.
By the way, one of the take-homes from this research is that if you are ever the victim of an emergency in a busy environment, it is best to single out one of the bystanders (to avoid diffusion of responsibility), tell this person that you need help (to avoid pluralistic ignorance), and, if possible, tell him or her exactly what you need, i.e., “Call 911!”
Failures of bystanders to intervene in emergencies are often publicized by the news media. Such stories may unintentionally increase cynicism. Fortunately, Mr. Tumpane’s helpfulness also received media attention and recognition.
Another place people hear about bystander intervention or its absence is in social psychology classes. One group of researchers randomly assigned students to hear a lecture either on Darley and Latane’s experiments, which included information about how to respond appropriately to an emergency, or a totally different topic (the control group). Two weeks later, as part of what they thought was an unrelated study, each of these students encountered a young man lying motionless on the floor. Was he sick or injured, or merely drunk or asleep? Only 25% of the students in the control group stopped to help the student, but 43% of those who had heard the lecture on bystander intervention stopped to help. Far from perfect, but better.
People often claim they would like the media to tell them more good news. Publicizing successful instances of bystander intervention, along with information about how best to intervene, would seem to be win-win for both the news media and future victims of emergencies.
We often receive information about alleged benefits or harms of existing or possible states of affairs. We may be told that North Korea has missiles that can reach the United States or that carbon sequestration and storage is a viable strategy for preventing climate change. How do we determine whether such information is credible?
One basic principle is that “bad is stronger than good.” We are more likely to pay attention to and remember negative information than positive information. The costs of mistakenly believing hazard information, unnecessary precautions, are much lower than the costs of mistakenly disregarding such information, which may include injury or death. There is no such asymmetry between the costs of mistakenly accepting or dismissing positive information. We are more vigilant toward hazards because the stakes are higher.
This is related to the principle of loss aversion in decision making. We consider losing $1000 to be a more negative outcome than gaining $1000 is positive. The larger the amount, the greater this disparity. According to Kahneman, loss aversion is a product of our evolutionary history: “Organisms that treat threats as more urgent than opportunities have a better chance to survive and reproduce.”
In 2014, the journal Behavior and Brain Sciences published a target article by political scientist John Hibbing and two colleagues presenting research suggesting that conservatives are more physiologically and psychologically responsive to negative information than liberals. This negativity bias causes conservatives to prefer stability rather than change, which can be seen as threatening. The article was followed by 26 commentaries by social scientists, most of which questioned details of Hibbert’s argument, but did not seriously challenge its basic assumptions.
A new article by Daniel Fessler and others explores the implications of negativity bias (or threat bias) for information processing. They conducted two separate, but similar, studies involving a total of 948 participants recruited through the internet. Particpants read 16 statements, half of which claimed the existence of a benefit while the others claimed to have identified a hazard. The majority of the statements (14 of them) were false. Here are two examples.
People who own cats live longer than people who don’t.
Terrorist attacks in the U. S. have increased since September 11, 2001.
Respondents were asked whether they believed each statement on a 7-point scale ranging from absolutely certain the statement is false to absolutely certain it is true. They were also asked judge the magnitude of each benefit or hazard on a 7-point scale running from small to large. (The benefit and hazard items had been matched in magnitude on the basis of previous testing.) The authors created an index of credulity by multiplying the judged truth of the statements by the magnitude of their benefit or hazard. Negativity bias was computed by subtracting the credulity of the eight benefits from the credulity of the eight hazards.
The authors constructed a summary measure of liberalism-conservatism combining input from four measures: an issues scale asking them to evaluate 28 political concepts, i.e., gun control; a social principles index asking them to choose between 13 social principles, i.e., punishment vs. forgiveness; self-ratings on a 9-point liberalism-conservatism scale; and political party affiliation.
Replicating Fessler’s previous research, they found that, for the sample as a whole, hazards were rated as more credible than benefits. As they predicted, there was a positive relationship between conservatism and this negativity bias. Breaking the effect down, they found that conservatives rated hazards as more believable than liberals, but there was no difference between liberals and conservatives in the credibility of benefits.
Of the four components of the conservatism measure, the issues index accounted for greatest portion of its relationship to negativity bias. This index contained three types of items: social conservatism, i.e., school prayer; military conservatism, i.e., drone strikes; and fiscal conservatism, i.e., tax cuts. As shown in the chart below, only social conservatism was strongly related to negativity bias. Fiscal conservatism was unrelated to it, while the relationship between military conservatism and negativity bias was positive but not statistically significant.
(For you statistics nerds, in these charts, the small squares indicate the sizes of the correlations and the lines indicate the confidence intervals. If the line crosses zero, the relationship is not statistically significant. Study 1 is on the left; Study 2 on the right.)
It is impossible to state, in the abstract, whether conservatives have a better strategy than liberals for processing information about potential hazards. If we had independent evidence suggesting that the hazard information were true, the conservative strategy would be more rational, while the liberal approach would be more sensible if the information were known to be false.
We can say, however, that their negativity bias leaves social conservatives vulnerable to alarmist rhetoric such as candidate Donald Trump’s often repeated claim that the homicide rate in the U. S. is the highest it has been in 45 years, or his attempt to publicize crimes committed by immigrants.
In a previous post, I reported that conservatives are more likely than liberals to rate syntactically correct but meaningless statements—technically known as “bullshit”—as profound. There is also evidence that conservative websites contain a higher percentage of “fake news.” It would be interesting to know how many of these fake news stories report alleged threats to people’s well-being. There may be a pattern here.
Much of today’s most alarming rhetoric deals with threats of terrorism. Since 2001, an average of 40% of Americans report that they fear they will be victims of terrorism. The actual probability of perishing in a terrorist attack—about one in four million per year—contrasts favorability with more prosaic dangers such as being killed in an auto accident or drowning in the bathtub. Fear of terrorism imposes enormous financial and social costs on our society, way out of proportion to the actual threat. These fears are ripe for exploitation by politicians. How much freedom have Americans already surrendered in the name of false security? As Timothy Snyder notes in On Tyranny, “It is easy to imagine situations in which we we sacrifice both freedom and safety at the same time: when we . . . vote for a fascist.”
A 2016 Washington Post analysis showed that Black Americans are 2.5 times as likely to be shot and killed by police officers than White Americans, and that unarmed Blacks are 5 times as likely to be shot dead than unarmed Whites. While there are many explanations for this finding, there is little support for the knee-jerk conservative response that attributes this racial disparity to the fact that Blacks commit more crimes. An analysis of the U. S. Police Shooting Database at the county level found no relationship between the racial bias in police shootings and either the overall crime rate or the race-specific crime rate. Thus, this racial bias is not explainable as a response to local crime rates.
When police officers shoot an unarmed Black teenager or adult, they are not likely to be convicted or even prosecuted if they claim to have felt themselves threatened by the victim. This suggests that it’s important to look at factors that affect whether police officers feel threatened. A study by Phillip Goff and others found that participants overestimated the ages of teenaged Black boys by 4.5 years compared to White or Latino boys, and rated them as less innocent than White or Latino boys when they committed identical crimes. While age may be related to perceived threat, the present study by John Paul Wilson of Montclair State University and his colleagues is more relevant, since it looks at the relationship between race and the perceived physical size and strength of young men.
The researchers were extremely thorough. They conducted seven studies involving over 950 online participants. Unless otherwise specified, participants were shown color facial photographs of 45 Black and 45 White high school football players who were balanced for overall height and weight. In the first study, the Black athletes were judged to be taller and heavier than the White athletes. Furthermore, when asked to match each photo with one of the bodies shown below, they judged the young Black men to be more muscular, or, as they put it, more “formidable.”
In a second study, participants were asked to imagine that they were in a fight with the person in the photograph, and were asked how capable he would be of physically harming them. The young Black men were seen as capable of inflicting greater harm.
In the third study, the authors examined the possibility that racial prejudice might predict these physical size and harm judgments. A fairly obvious measure of prejudice was used. Participants were asked to complete “feeling thermometers” indicating their favorability toward White and Black people. This measure of prejudice was only weakly associated with the participants’ judgments of Black-White differences in harm capability and not at all with Black-White differences in harm perception.
Up to this point, Black participants were excluded. However, the fourth study compared Black and White participants. Both Blacks and Whites saw the young Black men as more muscular, though the effect was larger for Whites. Only White participants saw the Black men as more capable of inflicting harm. Apparently Black participants subscribe the the size stereotype, but not to the stereotype about threat.
The fifth study was an attempt to apply these results to the dilemmas faced by police officers. Once again, both Blacks and Whites participated. They were asked to imagine that the young men in the photographs had behaved aggressively but were unarmed. How appropriate would it have been for the police to use force? White participants saw the police as more justified in using force against the young Black men than against the young White men. For the Black participants, there was no difference.
Previous research had shown that Black men who have an Afrocentric appearance—that is, who have dark skin and facial structures typical of African-Americans—are treated differently than Black men who are less prototypical. For example, in a laboratory simulation, participants are more likely to “shoot” a Black man if he has Afrocentric features, and a Black man convicted of murder is more likely to be sentenced to death if he is prototypical. The sixth study showed that young Black men whose facial features are prototypical are seen as more formidable and the police are seen as more justified in using force against them. Furthermore, this is true even when participants are shown photos of young White men. That is, White men with darker skin and facial features resembling Black men are seen as more muscular than other White men, and participants believe the police are more justified in using force against them.
In the final study, participants were shown the exact same photographs of men’s bodies with the head cropped off, but they were given additional information indicating the man was either White or Black. The photos were color-inverted to make the man’s race difficult to detect. The man’s race was indicated either by a Black or White face said to be the man in the photo, or a stereotypically Black or White first name. Results indicated that the very same bodies were seen as taller and heavier when the man was presumed to be Black than when he was presumed to be White.
You might be wondering whether Black and White men actually differ in size. Data from the Center for Disease Control shows that the average Black and White male has exactly the same weight, and that Whites are on average 1 cm taller. Therefore, when participants see Black men as larger, they are not generalizing from their real world experience.
These studies are important in explaining why police officers feel more threatened by young Black men than young White men, and why jurors are more likely to see the killing of young Blacks as justified. It may help to explain why no charges were brought against a Milwaukee police officer who shot Dontre Hamilton 14 times. The officer described Hamilton as “muscular” and “most definitely would have overpowered me or pretty much any officer I can think of.” Hamilton was 5’7” and weighed 169 lbs.
It is important to realize that the results of these studies are not readily explained by conscious race prejudice. This size estimation bias is probably automatic and unconscious, and is most likely to affect behavior when a police officer must make a split-second decision. The fact that officers are likely to be found not guilty of using excessive force against a Black victim if they testify that they felt threatened is troubling, since it suggests that implicit racial bias can be used successfully as a defense when charged with a violent crime.
Black performers seldom appeared on American television in the 1950s, so the only vintage Chuck Berry clips come from movies. This lip-sync of “You Can’t Catch Me” is from Rock, Rock, Rock (1956). Yes, he duck walks. He is introduced by Alan Freed.
Articles that end with confident assertions such as, “And that’s why Donald Trump is president,” are inherently suspect. A presidential campaign is a complex chain of events in which an almost infinite number of factors could have influenced public opinion by an amount greater than or equal to the margin of victory.
Consider this analogy. On the last play of the game, a football team is trailing by one point. Their kicker misses a relatively easy field goal from the opponent’s 25 yard line. Most spectators are likely to conclude that the missed field goal was the cause of their loss. However, if we were to watch a replay of the game, we might find dozens of offensive and defensive mistakes that, had they turned out differently, would have changed the outcome of the game. Picking any one of them as “the cause” of the loss is essentially arbitrary. It was the kicker’s bad luck to have failed on the very last play. Since it is readily available in everyone’s memory, people see it as the cause of his team’s defeat.
This is the first reason you should disregard the data I’m about to present and be skeptical of the claims that have been made for them.
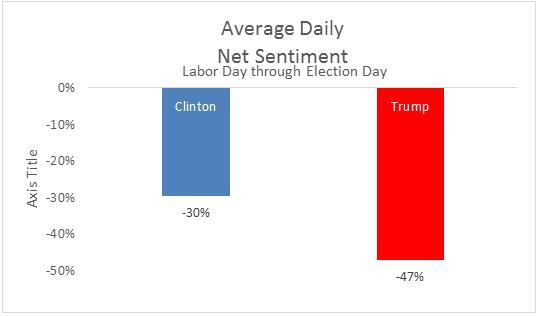
An organization called Engagement Labs does market research in which they attempt—for a price—to measure consumer attitudes toward brand name products. They do this by asking an online sample of consumers to report whether they have had any positive or negative conversations about the product. The difference between the percentages of positive and negative conversations is their measure of consumer “sentiment” toward the product.
Every four years, out of curiosity, this organization asks their respondents to report positive and negative conversations about the two major party presidential candidates. Not surprisingly, Americans had negative attitudes toward both candidates. Averaged over the duration of the campaign (Labor Day to Election Day), attitudes toward Trump (-47%) were more negative than attitudes toward Clinton (-30%).
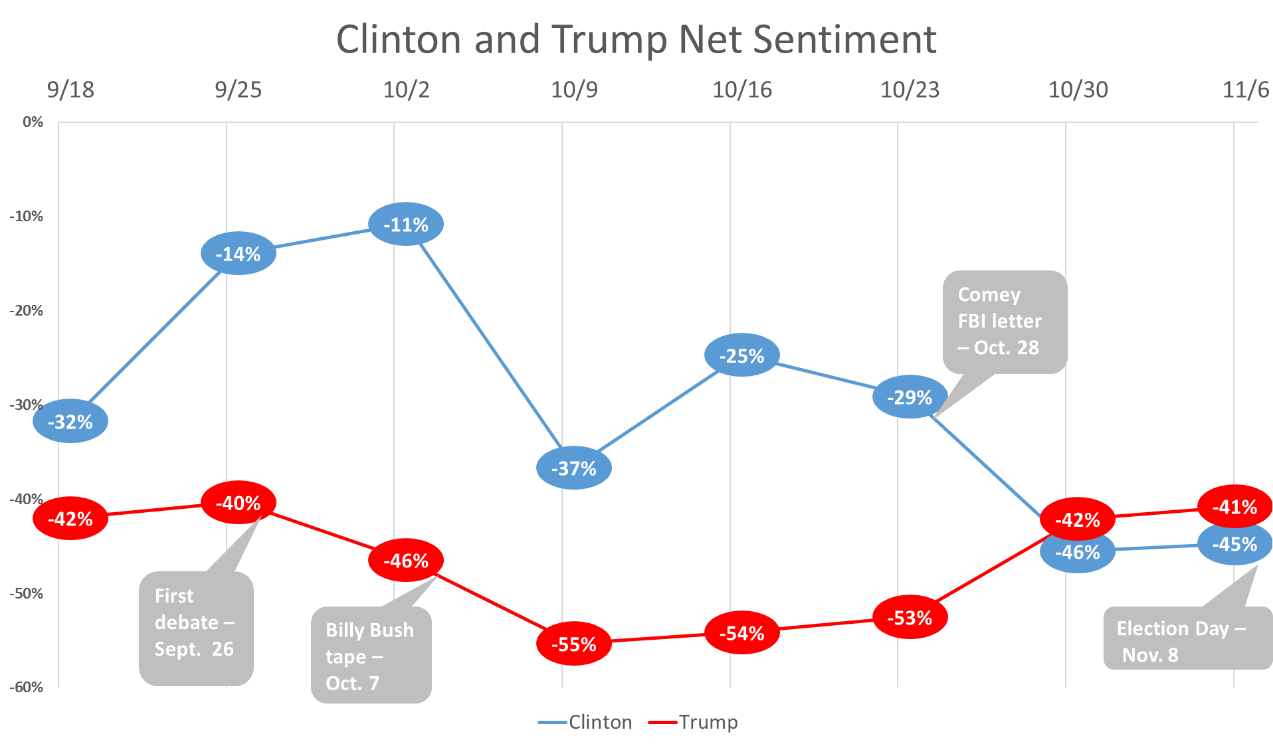
However, between the surveys conducted on October 23 and October 30, there was an abrupt change in their respondents’ conversations. October 28 was the day that FBI Director James Comey sent a letter to Congress stating that he was reopening his investigation of Hillary Clinton’s emails. Here are the data.
Two days after Comey’s letter, attitudes toward Clinton dropped by 17% and attitudes toward Trump increased by 11%—a 28% shift, sufficient to put Trump ahead. Trump maintained that slight edge on November 6, two days before the election.
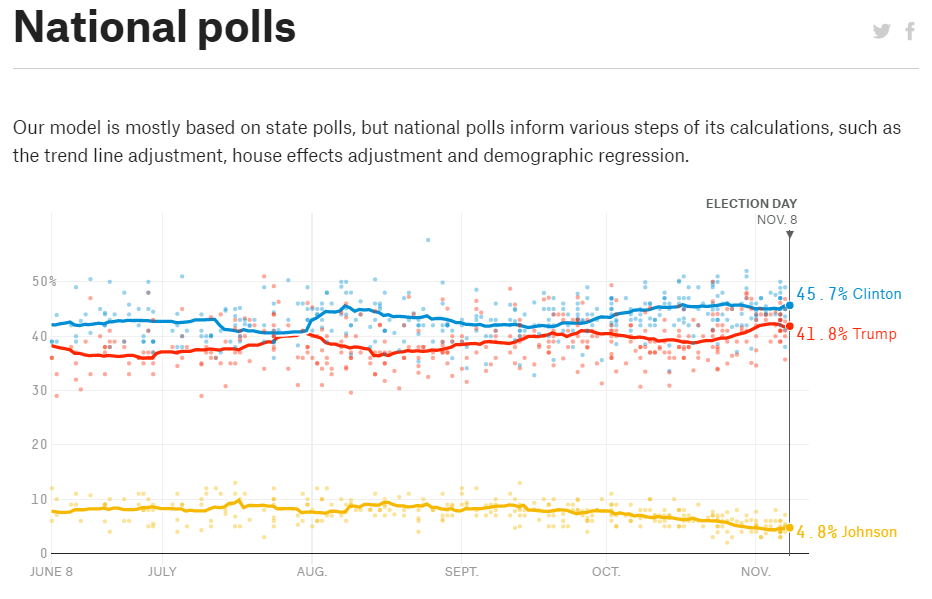
This is an astonishing change in attitudes. Such a large shift is almost never reported in pre-election surveys. Here’s the average of pre-election polls conducted by traditional methods.
Why didn’t other pre-election surveys report this abrupt shift in attitudes following Comey’s letter? Brad Fay, Chief Commercial Officer of Engagement Labs, maintains that their measure of political sentiment is a more sensitive predictor of election outcomes than the typical survey question which asks respondents for whom they intend to vote. He gives four reasons.
Behavior predicts behavior better than attitudes do. The behavior being predicted in this case includes the decision of whether to vote or stay home as well as for whom to vote.
The invisible offline conversation matters.
Conversations amplify the impact of the media.
Humans are a herding species. This is Fay’s way of saying that people conform to the expressed attitudes of other people.
However, there is a second reason you should be skeptical of the information in this post. I’ve searched the Engagement Labs website in vain for basic information about how their surveys were conducted—their sample size, their method of ensuring the representativeness of their sample, the wording of their questions, etc. All I can find is jibberish such as “(t)he data are fed into our TotalSocial platform, where it is scored and combined with social media data to capture the TotalSocial momentum for leading brands.” They probably regard this information as a trade secret. But until such information is provided, I’ll have to claim that this is an intriguing finding of uncertain validity.
Norway is the world’s leader in use of zero-emission, fully electric vehicles (EVs). They have 100,000 EVs on the road, over 5% of Norway’s cars. Thirty-seven percent of the new cars purchased in Norway last year were EVs. Norway’s transportation minister anticipates that the number of EVs on the road will rise to 400,000 in 2020, and that the sale of fuel burning cars will end by 2025.
Chevrolet Bolt
There’s a good reason for these trends—incentives. EVs are exempt from Norway’s value-added tax, which adds 50% to the cost of a new vehicle. They are also exempt from road tolls and tunnel and ferry charges. And they get free parking, free charging and the freedom to use bus lanes. These incentives have been so successful that Norwegian politicians are rolling them back. The value-added tax will soon be replaced by a subsidy, which may eventually be phased out. EV owners will have to start paying 50% of the state road charges in 2018, and local authorities are now free to curtail free parking, local tolls, and the use of bus lanes.
What about the price? The average price of a new car is $31,000. To be competitive, the cost of an EV must drop to between $25,000 and $35,000. A new Tesla costs $35,000 and a Chevy Bolt sells for $37,5000. The prices are dropping due to a combination of mass production and the decreasing cost of batteries. This analysis by Bloomberg New Energy Finance projects the future trends in the cost of battery electric vehicles (BEVs) in thousands of dollars (on the left) and the percentage of Americans willing to buy at those prices (on the right).
Currently, Americans can get a federal income tax credit of up to $7500 for purchasing an EV, but there are conditions. This chart summarizes the current status of federal and state incentives, some of which expired at the end of last year.
The other day in California, last week, a woman, 66 years old, a veteran was killed, raped, sodomized, tortured and killed by an illegal immigrant. We have to do it! We have to do something! We have to do something!
Presidential candidate Donald Trump
Judgmental heuristics are the simple rules or mental shortcuts that people use to make decisions quickly and efficiently. One of those rules is the availability heuristic, which states that the frequency of an object or event is judged on the basis of the number of instances retrieved from memory and the ease with which they come to mind. The easier it is to think of examples, the more frequent the object or event is assumed to be.
The availability heuristic often leads to correct inferences. In the northeastern United States, robins are in fact more common than other birds. But availability can be misleading. For example, when estimating the frequency of various causes of death, people overstimate dramatic events such as homicides and traffic accidents and underestimate less public illnesses such as strokes and diabetes. The presumed explanation is media salience. Estimates of the frequency of causes of death are highly correlated with space devoted to types of death in recent newspapers.
The availability heuristic is one explanation for for a common cognitive error known as the base-rate fallacy. This refers to a tendency to overgeneralize from individual examples while ignoring statistical base rates. A specific case is more emotionally interesting and easier to remember; it is more available. A statistical statement is not as interesting. Base rates are usually underweighted, and sometimes completely disregarded, especially when specific instances are available. It follows that if propagandists want people to overestimate the frequency of an event, they should publicize examples of that event, preferably with vivid pictures and lots of memorable details.
Availability biases can influence social policy. An availability cascade is a self-sustaining chain of events that starts with a small number of cases that are heavily publicized by the media, leading to public panic and large-scale government action. One goal of terrorism is to start availability cascades. An availability campaign occurs when some pressure group, for altruistic or self-interested reasons, tries to instigate an availability cascade.
I was reminded of this by last Tuesday night’s address to Congress when President Trump introduced four alleged victims of crimes committed by immigrants who were seated in the audience and announced an executive order creating an office called Victims of Immigration Crime Engagement (VOICE) within the Department of Homeland Security, whose purpose is to make public “a comprehensive list of criminal actions committed by aliens.” (He didn’t say that the “aliens” had to be in the country illegally.) Right-wing news organizations have been heavily reporting real or fake crimes committed by immigrants for several years.
Apparently the President thinks that one way to increase support for his immigration policies—the wall along the Mexican border, mass deportations, the Muslim ban—is to induce Americans to overestimate the frequency of crimes committed by immigrants. To this end, he is starting an availability campaign.
What is the actual base rate of crimes by immigrants? Research consistently shows that immigrants commit crimes at a lower rate than native-born Americans. Robert Adelman and his colleagues analyzed data from 200 metropolitan areas from 1970 to 2010. They found that as immigration increased, rates of murder, robbery, burglary and larceny decreased, and rates of aggravated assault remained the same.
In a forthcoming study, Charles Kubrin and Graham Ousey conducted a meta-analysis combining the results of over 50 studies examing the relationship between immigration and crime published between 1994 and 2014. Their conclusion: “More immigration equals less crime.” However, the rate of crime by second generation immigrants–that is, the children of immigrants–does not differ from than of other Americans.
Kristin Butcher and Anne Piehl studied why immigrants commit crime at lower rates than non-immigrants. They concluded that people who self-select to immigrate to the U. S. are less criminally active than the native born population, and are more responsive to deterrents to crime, such as the threat of a jail sentence.
This is not the only instance in which the president has presented misleading information apparently intended to persuade us that the exception is the norm. He has criticized the media for “underreporting” acts of terrorism by Muslims, when in fact the opposite is the case. In last week’s address, he cited an unrepresentative 116% increase in health insurance premiums in Arizona to support his claim that the Affordable Care Act was failing.
Until 1938, it was the policy of Hitler’s Ministry of Justice to forward all criminal indictments of Jews to the press office to be publicized. With VOICE, the U. S. now has its own government-run ministry of propaganda given the mission of convincing us of something that isn’t true—that immigrants commit more crimes than native born Americans.


 Although partisan differences of opinion on the value of labor unions and the news media were anticipated, differences in approval of colleges and universities were just as large. Moreover, partisan differences over the effects of colleges
  The change is almost entirely attributable to Republicans. Although Democratic attitudes toward colleges have remained stable, Republican attitudes have shifted dramatically in the negative direction. As recently as 2015, 54% of Republicans said colleges had a positive impact on society and 37% said their impact was negative.
 The Pew survey is silent about the reasons for this change in opinion, so I guess I’m free to speculate. First of all, we should remember that there has been
  The middle and lower class young people for whom the State System of Higher Education (SSHE) was intended have largely been priced out of the market. Enrollment is dropping (for this and other reasons).


 How good are all-electric vehicles for the environment? Very. This video reports the results of a recent analysis by the


You must be logged in to post a comment.