Monthly Archives: January 2017

Who Speaks for the Nones?

As the percentage of Americans who call themselves Christians declines, the number of Christians in Congress continues to hold steady. In the new 115th Congress, 91% identify themselves as Christians, according to new research by the Pew Research Center. This is the same as the last Congress, and not much different from the 95% of Christians in 1960-61, the earliest years from which data are available.

Among 293 Republicans, 291 are Christians and 2 are Jews. The 242 Democrats are slightly more diverse, with 194 (80%) Christians, 28 Jews, three Buddhists, three Hindus, two Muslims, one Unitarian and one who is religiously unaffiliated (Arizona’s Rep. Kyrsten Sinema). There were also ten Democrats who declined to answer.

Protestants, Catholics and Jews are all overrepresented in Congress, compared to their percentage of the population. The only major group that is underrepresented is the “nones”—the religiously affiliated. As previously reported here, the nones went from 16% of the population in 2007 to 23% in 2014, while the number of Christians dropped from 78% to 71%. In Congress, 91% of members are Christians and .2% are nones, unless some of those ten Democrats who refused to answer are trying to hide their lack of religiosity.

It is likely that the same forces that result in minority rule by rural, small state Republicans—structural biases in the composition of the House, the Senate and the electoral college—also account for the overrepresentation of Christians.

In addition their differences on obvious culture war issues such abortion and gay rights, Christians are less likely than the religiously unaffiliated to favor government assistance for the poor and less likely to favor environmental protection. They are more likely to say that peace is best assured through military strength. In addition, religious people are more likely to be racially prejudiced.

You may also be interested in reading:

And Then There Were Nones

More Bad News for Religion

Why the Minority Rules

China Gets Smart While We Get Stupid

China announced last week that it is planning to invest $361 billion in renewable energy development during the 5-year period between 2016 and 2020. The breakdown is as follows: 40% will go to solar power, 28% to wind, 20% to hydro, and the remainder to tidal, geothermal and biomass. The plan is expected to create 13 million new clean energy jobs. It puts China on schedule to meet its greenhouse gas reduction goals from the 2014 U. S.-China treaty five years ahead of time.

Even so, China’s situation illustrates the heavy role that inertia plays in energy consumption. By 2020, renewables are expected to account for only 15% of its total energy, with coal still acounting for more than half.

Offshore wind farm near Shanghai, China.

China’s heavy reliance on coal has exacted serious economic and social costs due to hazardous smog. Last year, as part of their “war on pollution,” the government closed 335 factories and retired 400,000 high-polluting vehicles from the roads. This is starting to pay off, since last year Beijing reported having 198 “blue sky days,” up from just 12 in 2015.

China’s new investments will make it the world’s dominant producer of renewable energy. They now have five of the six largest manufacturers of solar panels, the largest manufacturer of wind turbines, and the largest producer of lithium ion batteries. The Chinese have also proposed a plan for an international green energy grid, with companies from Japan, Russia and South Korea scheduled to participate. The grid is based on the principle that, although sunshine and wind are intermittent at any one place, with a large enough grid, energy can be transfered one location to another to meet everyone’s needs.

Meanwhile, the U. S. is planning to continue to ignore both climate science and economic reality by increasing our reliance on fossil fuels, even as the President-elect makes blatantly false statements about renewable energy.

You may also be interested in reading:

Cheaper Solar Changes Everything

Community Solar

The Way of Ta’u

Heavy Traffic

It should be fairly evident that living next to a busy road is not a great idea. In 2010, the Health Effects Institute examined over 700 studies and found sufficient evidence to link traffic pollution to childhood asthma, cardiovascular diseases and impaired lung function. Evidence linking traffic exposure to cancer was deemed inconclusive.

A new epidemiological study by Dr. Hong Chen and colleagues found that living near a major road is associated with an increased risk of dementia. The most common form of dementia is Alzheimer’s disease. The authors tracked all people between the ages of 20 and 85 living in Ontario, Canada (6.6 million people) between 2002 and 2012. Medical records were examined to determine whether they were diagnosed with dementia, Parkinson’s disease or multiple sclerosis. Their proximity to a major roadway was determined by postal code. The data analysis statistically controlled for alternative explanations such as socioeconomic status, education, smoking, diabetes and body mass index.

Living near a major highway was associated with dementia, but not Parkinson’s disease or MS. They identified 243,611 cases of dementia. Those who lived within 50 meters showed a 7% increase in the risk of dementia; those between 50 and 100 meters, a 4% increase; and those between 100 and 200 meters, a 2% increase. The greatest risk was found among those who had lived within 50 meters of the roadway for the entire decade, a 12% increase in the likelihood of dementia. According to their analysis, for those who lived within 50 meters, up to 1 in 10 cases (7-11%) of dementia were accounted for by traffic exposure.

Of course, this is a correlational study, and it is possible that other uncontrolled variables account for part of the effect. The fact that they measured diagnoses of dementia raises the possibility that the decision to seek treatment was a possible contaminant. However, it is not obvious why, in a country with universal healthcare, people living near major highways would be more likely to seek treatment.

The authors suggest that the effect may be due to a combination of air pollution and noise. They found that long-term exposure to two common pollutants, nitrogen dioxide and fine particulate matter, is related to dementia, but the effect is not large enough to explain their results. Studies have found toxic nanoparticles linked to Alzheimer’s disease in human brain tissue.

Noise is an environmental stressor that has been linked to declines in cognitive performance. Heat and crowding are two other stressors that may be plausibly linked to heavy traffic. A previous study found that children whose schools were located near major roadways in Barcelona showed smaller improvements in cognitive performance than other children from the same city.

You may also be interested in reading:

Unsafe Exposure

I Cough in Your General Direction

Get the Lead Out, Part 1

So Far, It Looks Like It Was the Racism

One question has dominated the conversation among political scientists attempting to explain the presidential election: Were Trump’s supporters motivated primarily by economic anxiety or racial resentment? So far, I’ve avoided weighing in on this question, hoping that the definitive study would appear. It hasn’t yet, but a new experiment by Michael Tesler is interesting enough to warrant giving you a progress report.

The corporate media narrative clearly favors the economic explanation. In a typical article, we are told (correctly) that the family incomes of working class families have been stagnant for 35 years, that trade agreements and the 2008 recession have caused widespread unemployment and underemployment, and that both political parties have ignored the plight of these Americans. This is followed by interviews with a couple of Trump supporters who express pain and anger over the way they have been treated. However, this is anecdotal evidence. The answers given by Trump supporters are partially driven by the questions they are asked. For the media, framing the election in terms of economic anxiety rather than racism avoids offending Trump and his supporters.

Much of the evidence available prior to the election failed to support the economic anxiety narrative. Surveys showed that racial attitudes predicted Trump support better than economic attitudes—for example, these two, and this one. This large sample Gallup poll also cast doubt on the economic explanation. The median household income of a Trump supporter in the primaries was $72,000, higher than the median income of Clinton supporters ($61,000) and the general population ($56,000). In addition, post-election analyses showed that Clinton received more votes in economically-distressed communities—those with a higher percentage of their population below the poverty line.

Michael Tesler has been studying the racialization of politics for over a decade. Racialization refers to the tendency of racial attitudes to influence opinions toward a variety of other issues not obviously related to race, such as health care or gay marriage. Tesler embedded an experiment within a YouGov/Huffington Post national survey of 1000 voters conducted on December 6 and 7. Half the participants were asked if they agreed with the following statement:

Over the past few years, Blacks have gotten less than they deserve.

Ths is an item from the Symbolic Racism Scale, which is used to measure racial resentment. The remaining respondents were presented with this statement.

Over the past few years, average Americans have gotten less than they deserve.

Most people assume an “average American” is White. In 2005, Devos and Banaji conducted a series of five studies showing that the category “American” is more strongly associated with the category “White” than either “African-American” or “Asian-American.” Based on this evidence, Tesler assumed that respondents would interpret the second statement as referring to Whites. He then compared the responses of people who reported that they had voted for Clinton and Trump to these two questions.

This study pits the economic anxiety and racial resentment explanations against one another. Would Trump voters be more likely than Clinton voters to agree that average Americans have gotten less than they deserve? Or would differences emerge only when the question referred to Black Americans?

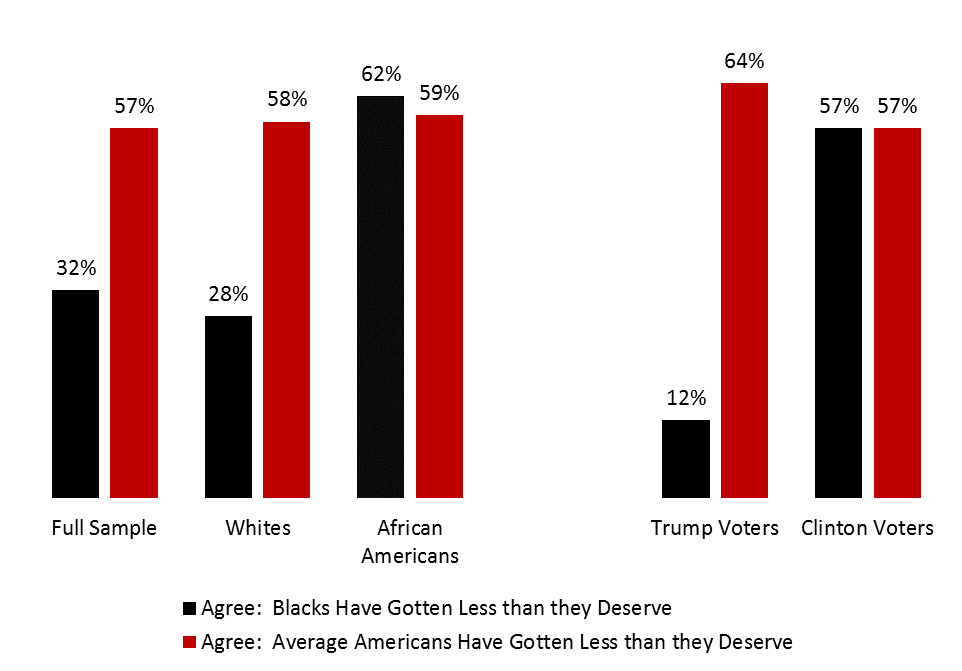
The results on the left show a typical racial divide between Black and White respondents. White participants were more than twice as likely to think that average Americans had gotten less than they deserve than to think that Blacks had gotten less than they deserve. Black participants thought everyone had gotten less than they deserve. Since there were more White than Black participants, the averages for the full sample resembled those of Whites.

The data on the right address the research question. Clinton voters were almost as likely (57%) to say that average Americans have gotten less than they deserve as Trump voters (64%). Since this was a large sample, this 7% difference is probably statistically significant, but it is small in comparison to the difference on the racial resentment item. Only 12% of Trump supporters agreed that Blacks had gotten less than they deserved, compared to 57% of Clinton supporters—a difference of 45%. The data are more consistent with the racial resentment interpretation of Trump’s victory.

Tesler frames the responses of Trump supporters as an example of the ultimate attribution error. Attribution is the processes by which we infer the causes of behavior. The ultimate attribution error is the tendency to take personal credit for our own successful behavior and that of our in-group, and blaming our failures on environmental obstacles, while at the same time blaming members of out-groups for their failures, and attributing their successes to unfair advantages. Given this bias, it follows that Whites have gotten less than they deserve, while Blacks have gotten more.

Were the election results caused by economic anxiety or racism?  We still await a more definitive study. It will require a larger sample of voters and a valid measure of economic anxiety, with statistical controls for other variables known to influence voting decisions. If I see such a study, I’ll let you know.

You may also be interested in reading:

Trump’s Trump Card

What Does a Welfare Recipient Look Like?

Framing the Debates

The Hidden Injuries of (the) Class(room)

This is the first of what I expect to be a series of posts on The Hidden Injuries of Class, named for the 1973 book of that title by Jonathan Cobb and Richard Sennett.

It is obvious that education is one of the primary institutions that reproduces social inequality; that is, it is one of the main reasons there is so little social mobility in the United States. Most commentators attribute this to two reasons.

The current research focuses on a third possibility—class differences that emerge from within the classroom. Since UMC children are more familiar with classroom norms, more “education-ready,” the classroom is not a level playing field, but rather one in which UMC children perform better while WC children appear more withdrawn and less intelligent. One classroom tradition that elicits these class differences in behavior asking students to raise their hands. Hand-raising introduces competition and social comparison into the classroom environment, which can be detrimental to the self-esteem of WC kids.

Sebastien Goudeau and Jean-Claude Croizet conducted three experiments with fith and sixth grade French school children. Children were divided into those with WC and UMC backgrounds according to the status of the parent with the highest occupational level. In the first study, 953 students responded to a reading comprehension test in which 15 questions were read and posted on a screen and the children wrote their answers is a notebook. The number of correct answers was scored. In a randomly determined half of the classes, students were instructed to raise their hands when they thought they knew the answer. In the other classes, this instruction was omitted.

The results showed that hand-raising interfered with the performance of the WC children but had no effect on the UMC kids.

In the other two experiments, the children’s actual social class was not a variable. Instead, the authors attempted to create a cultural advantage for half the children. The students performed a coding task in which they were asked to write down symbols that had been associated with certain letters. Half the students were given fifteen practice trials to become familiar with the coding task, while the others were given only five practice trials. Each class contained a mixture of students who were more or less familiar with the coding task.

As before, in half the classes, the kids were asked to raise their hands when they knew the answer, and in the other half, they were not. The results showed that hand-raising disrupted the performance of the students who were less familiar with the task, but had no effect on those more familiar with it.

Part of the reason social class differences are so discouraging to WC children is their hidden nature, which creates the illusion that there are real differences in ability between WC and UMC children. In the third study, all classes were instructed to raise their hands when they knew the answer, but an additional variable was introduced. Half of the classes were correctly informed that some students had had more opportunity to practice than others, while the other classes were not. When the students who were less familiar with the task were informed that others had this advantage, hand-raising no longer disrupted their performance.

Godeau and Croizet propose that UMC children enter school with more cultural capital than WC children. Parents provide their children with social capital when they teach them the skills and attitudes they need to succeed in school. Certain classroom practices, such as asking children to read aloud in front of the class, will serve to increase these differences. Asking teachers to avoid these activities is unlikely to be successful, and might deny WC kids an opportunity to overcome their deficits. More promising might be a preschool experience in which WC children are familiarized with educational culture. They should  be told often that their unfamiliarity with these behaviors does not mean that they are stupid.

You may also be interested in reading:

Racial Profiling in Preschool

Asian-American Achievement as a Self-Fulfilling Prophecy

Cheaper Solar Changes Everything

Photo credit: Mataparda

In 2016, for the first time, the U. S. added more electricity-generating capacity from solar power plants than from natural gas, wind, or any other source of energy. The total of 9.5 gigawatts (GW) of solar generating capacity is triple the amount added in 2015 and is enough to provide electricity for 1.8 million homes. Here are the data as reported to the U. S. Energy Information Administration. (The apparent surge in new generating capacity in December is due to respondents’ habit of waiting until the end of the year to report new installations.)

The top five states adding new solar are California (3.9 GW), North Carolina (1.1 GW) Nevada (.9 GW), Texas (.7 GW) and Georgia (.7 GW). These data are for utility-scale photovoltaic solar installations and do not include distributed generation (rooftop solar). In addition to solar, 8 GW of natural gas and 6.8 GW of wind power were added. No new coal-fired plants were built last year.

Before we get too excited about this, it should be noted that solar power still provides only 1% of the nation’s electric power, a total of 35.8 GW.

What accounts for this rapid solar growth? It’s not federal investment tax credits, which remained at 30%, the same as in previous years. The explanation is the rapid decline in the cost of photovoltaic cells, which has dropped from $77/watt in 1977 to $.26/watt in 2016.

It’s difficult to get a handle on the cost of various sources of power, since it varies from one country to another and depends on whether government subsidies are included. The world’s average cost of solar is now the same or less than any other energy source except wind. (See the chart below.)

Levelized cost of energy refers to the net cost to install an energy system divided by its expected lifetime output. Levelized cost data typically include subsidies. The average levelized cost of solar had dropped to $600 per megawatt-hour (MWh) a decade ago and is now at or below $100/MWh, about the same as coal and natural gas. In other words, solar has reached grid parity with fossil fuels. The cost of land-based wind power is about $50/MWh.

The above figures are for the average of all countries. However, a recent Bloomberg report claims that for 58 emerging economies, including China, India and Brazil, the cost of new solar has dropped below that of wind. The difference may be due to the location of these emerging countries, which are nearer to the equator than wealthier countries, and their need to add new capacity quickly, which creates economies of scale. It had been anticipated for some time that solar would eventually be cheaper than wind power, but few analysts expected it to happen this fast.

The problem is subsidies. According to the International Energy Agency, fossil fuels received $493 billion in subsidies worldwide in 2014, the most recent year for which figures are available. This is more than four times the subsidies received by renewables. On a level playing field, there would be little reason to add anything but solar or wind power.

You may also be interested in reading:

Community Solar

The Way of Ta’u